How to read your Helix diagnostic report, section by section
Your child closed the laptop. The report loaded. There is a green number at the top, four colored bars under it, a plan with three phases, a grid of tiles, and a chart projecting nine months out. It is a lot to take in at once, especially if MAP® scores are the only number you have ever been handed for your child's math.
This is a section-by-section guide to what each part of the Helix diagnostic report means and how to read it. We walk it in the same order the page renders, top to bottom. Every screenshot below is from a real (anonymized) report so you can put your child's report next to this one and read them side by side.
What the Growth Score at the top actually measures
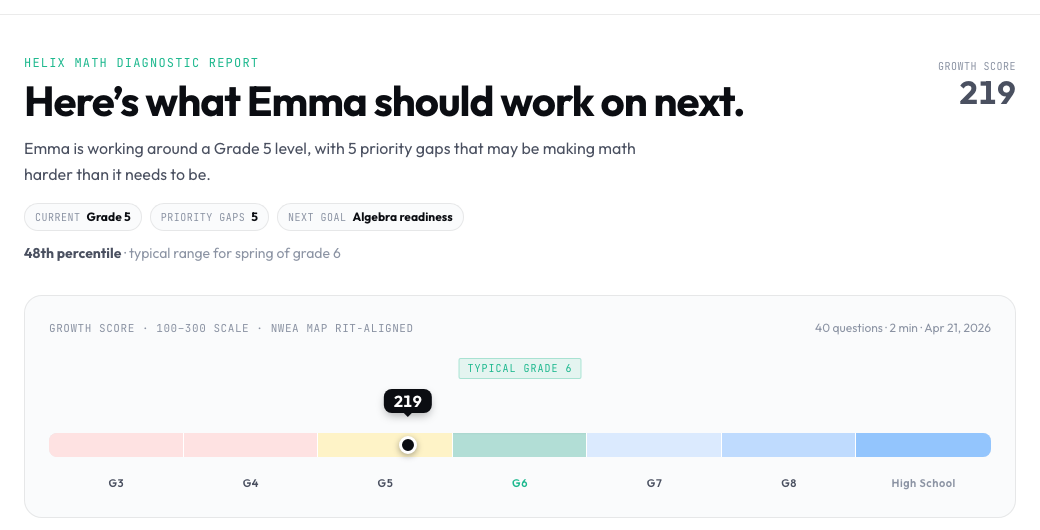
The largest number on the report, somewhere between 100 and 300, is your child's Growth Score. It is not a percentile. It is not a percent. It is a point on the same 100–300 ladder that the NWEA MAP report uses for the RIT® score. A Helix Growth Score of 215 means the same thing on the same scale as a MAP RIT of 215.
The score sits on a horizontal ladder labelled G3, G4, G5, G6, G7, G8, and High School. Each band marks the typical range for that grade. A 215 lands in the G5 band, the typical fall-to-winter range for 5th grade. A 230 lands in G8. A 240 lands in High School.
The colored shading behind the ladder names the relationship between the score and your child's own grade level:
- Red. The score sits two or more grade bands below your child's grade. A real gap. The plan exists to close it.
- Amber. One grade band below. Approaching grade level, not yet there.
- Green. On grade level. The most common position.
- Blue (lighter to darker). One, two, or three+ grade bands above. Headroom.
Below the ladder sits the question count, duration, and completion date. The diagnostic stops when Helix has estimated each strand confidently, usually around 35 to 40 questions. Long enough to be accurate. Short enough that your child still has the energy to learn from it afterward.
A Growth Score tells you where. It does not tell you which specific skills are stable and which are still shaky. That is what the rest of the report is for.
What the four strand bars break the overall score into
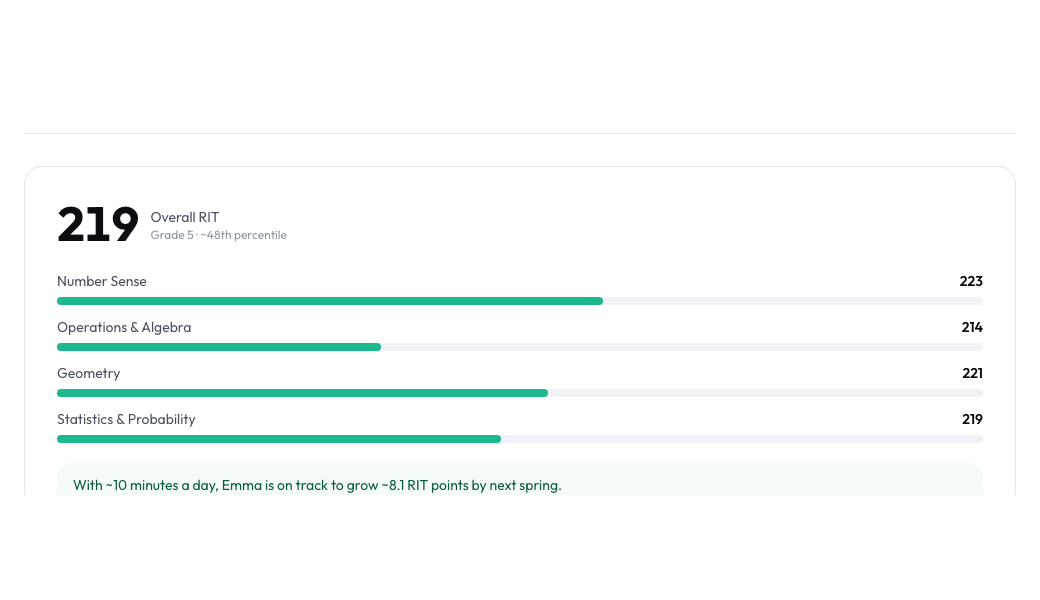
Right under the Growth Score, four horizontal bars split the overall number into its parts. These are the four strands the math curriculum is built from:
- Number Sense. Whole-number fluency, place value, fractions, decimals, integer operations.
- Operations & Algebra. Expressions, equations, ratios and proportions, linear functions, slope.
- Geometry. Area, perimeter, volume, angles, transformations, coordinate geometry.
- Statistics & Probability. Graphs, measures of center, probability, statistical reasoning.
Two students with the same Growth Score can have very different strand profiles. One strong in Number Sense but shaky in Operations & Algebra. The other the reverse. The overall score averages them. The strand bars do not. The average hides the gaps.
Above the bars sits the overall percentile against same-grade peers and the grade label of where the score lands on the ladder. The percentile uses NWEA 2025 norms. The grade label uses the same band cuts as the score ladder above it. The faint callout at the bottom estimates how much your child's score could move between now and next spring at a roughly ten-minutes-a-day pace.
What the plan tells you to work on, in order
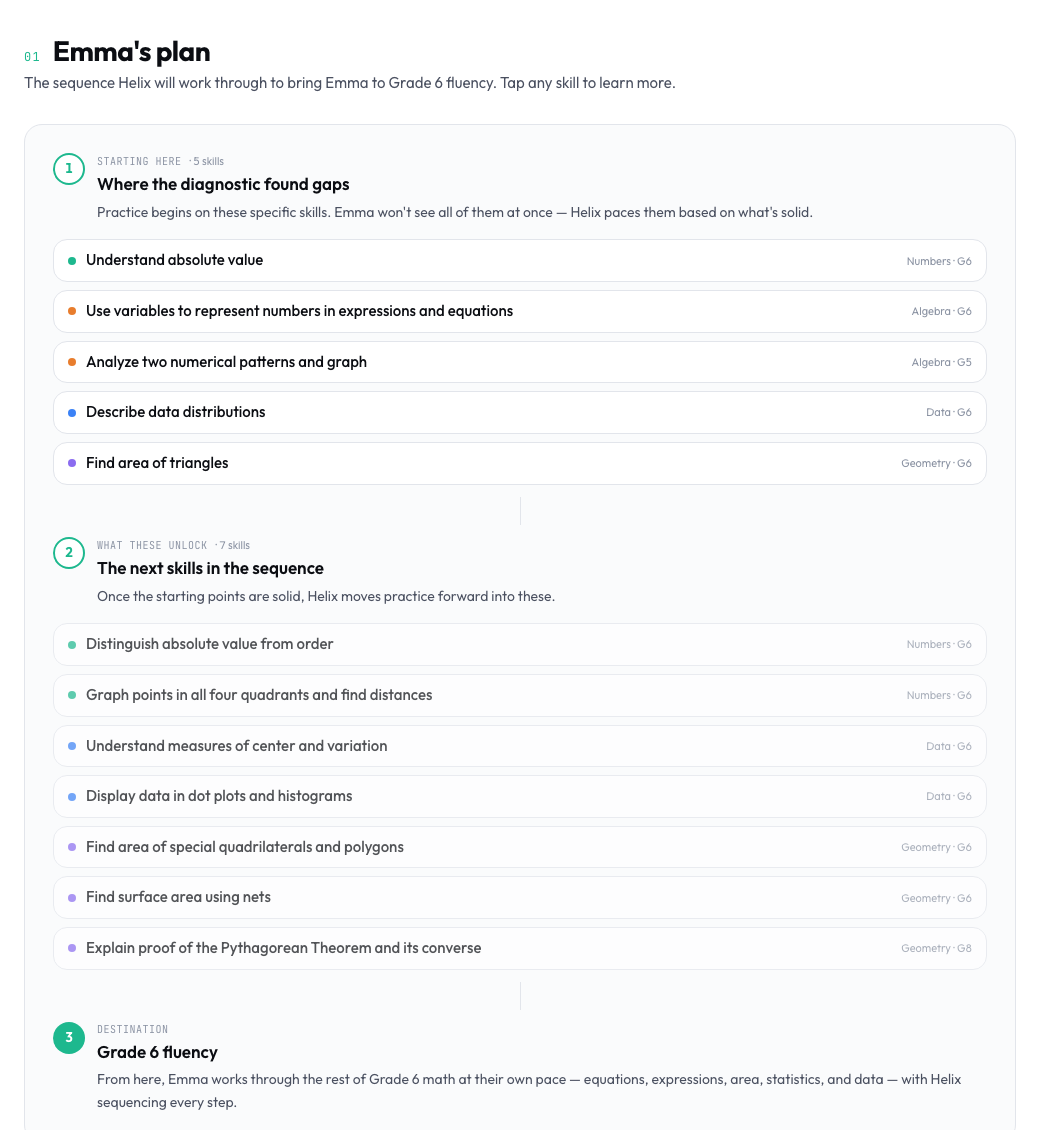
The first labelled band on the report is the Plan. It is a three-phase roadmap sequenced from your child's earliest gaps through to grade-level fluency:
- Starting points. The foundational skills that are shaky today. Often one or two grade levels below your child's current grade. They block downstream learning, so they get worked first.
- Downstream skills. The skills that depend on those starting points and that your child has not yet mastered. These come after the foundations are stable.
- Grade-level fluency. The on-grade skills that complete the picture once the prerequisites are in place.
Each phase is a list of skill chips. Tap any chip to see what the skill is, where it sits in the curriculum, and why it matters. The plan is sequenced. Helix works through it in order, and you do not need to pick where to start.
This is what Helix is for. The MAP report tells you the score. The plan tells you the next ten skills.
What the Learning Map shows that no other report does
The second band is the Learning Map. It is a grid of every skill in the grades 5 through 8 math curriculum, organized by strand (rows) and grade (columns). Each tile is one specific Common Core skill. Tiles are colored by mastery:
- Green. Mastered. Your child answered correctly and consistently.
- Amber. Emerging. Some correct answers; the skill is forming but not yet stable.
- Red. Priority. Shaky. This is where targeted practice has the most leverage.
- Gray. Not yet reached. The diagnostic did not get to this skill. It is either above your child's current level or in a strand the diagnostic exited early.
Above the map sits a one-line interpretation: "Most of {Name}'s priority gaps are in Numbers and Algebra. These are the best places to start." That sentence is computed from the priority-tile count per strand. It is the fastest read on which strands matter most for this specific child.
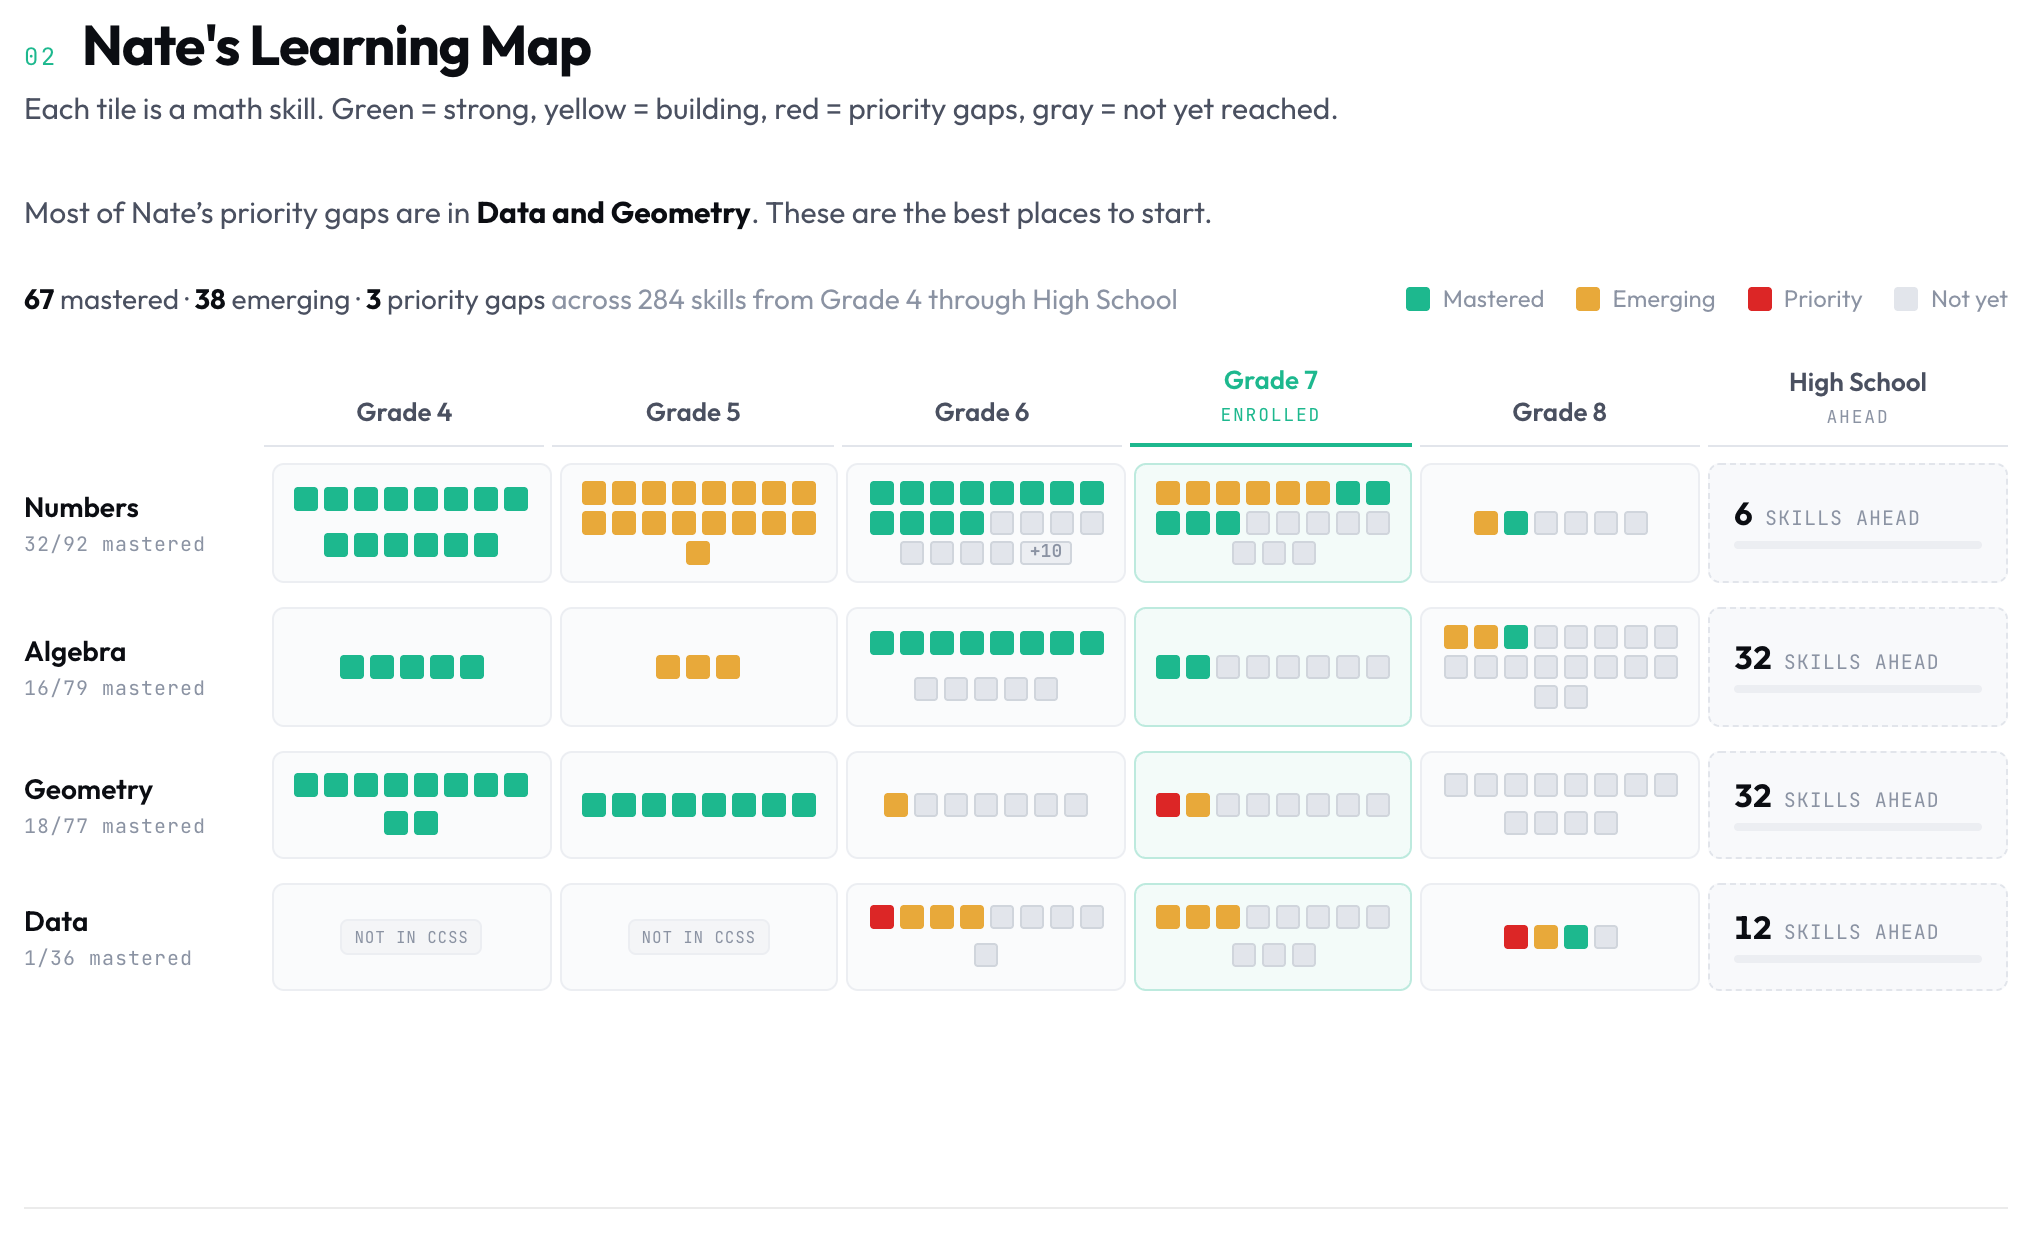
Grades 9+ collapse into a single "High School" column for students who tested above grade 8. The high-school content is pathway-agnostic (Algebra 1, Geometry, Algebra 2, Pre-Calculus, Calculus). The column is intentionally simplified at this stage of coverage.
Two students at the same Growth Score can have completely different Learning Maps. The shape of the red is the shape of the work.
What the 9-month projection means (and what it does not)
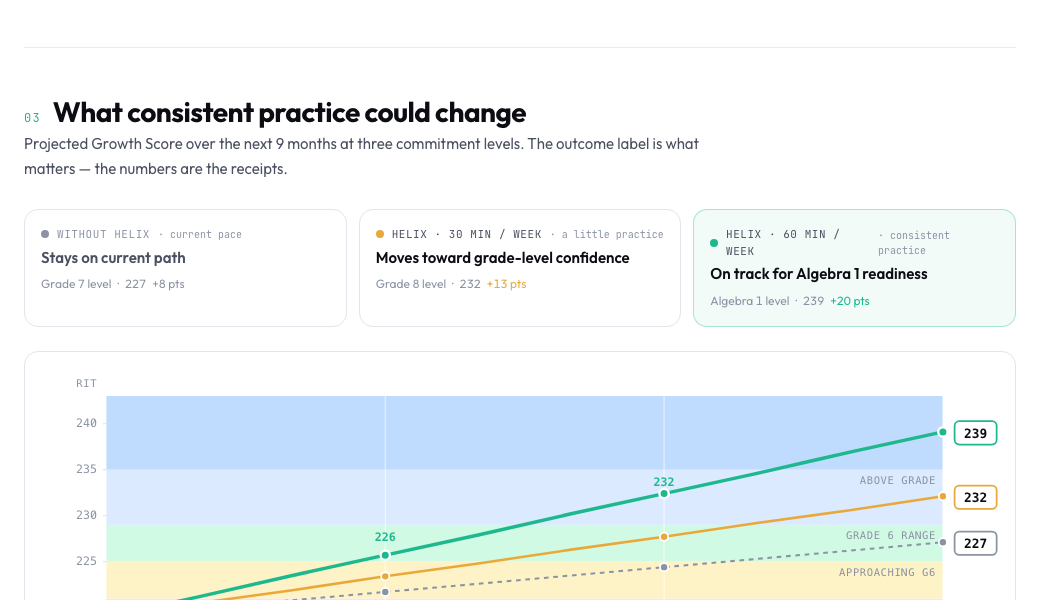
The third band is the 9-month projection. Helix models three commitment levels (the current pace, a light Helix pace, and a consistent Helix pace) and projects what the Growth Score could look like nine months from now at each level.
The chart uses the same achievement bands as the Growth Score ladder above (red / amber / green / blue), so the projection reads in the same visual language as the rest of the report. The label next to each line is what matters: "on grade level by spring," "a grade ahead by fall," "closing the gap." The numbers are the receipts.
This is a model, not a guarantee. The bands are calibrated from NWEA's 2020 growth norms and a meta-analysis of high-dosage tutoring effects (Nickow, Oreopoulos & Quan 2020). Real growth depends on consistency, not magic. The band structure is what most parents are actually trying to read on this band: will my child be on grade level by the next testing window?
What "How Helix works" tells you before you click the CTA
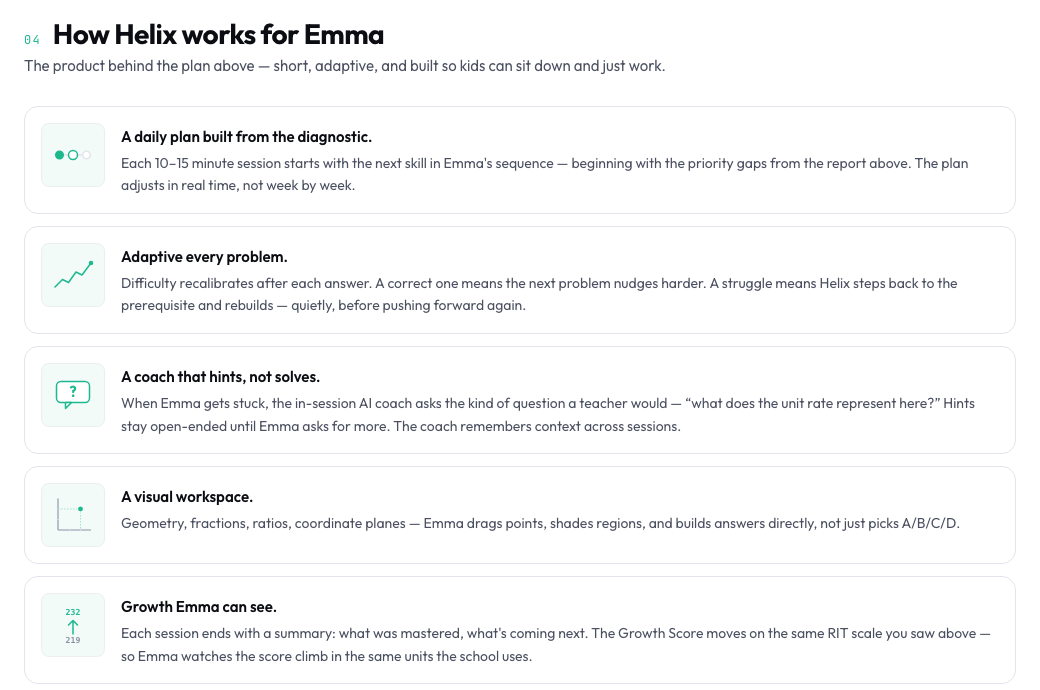
The fourth band is a short product walkthrough. It sits here so that parents who scrolled this far know what they are about to start. Short adaptive sessions, typically 10 to 20 minutes. One skill at a time. Hints available but never forced. The engine practices the shaky skills, not the ones already stable, and stops working a skill when it is genuinely solid.
For the full product walk-through, see About Helix Math.
How to share, print, or email the report
In the header of the report sit three small icons:
- Share. Generates a public link (
helixmath.com/r/<token>) you can send to a teacher, a tutor, a co-parent. The public version shows the same content without requiring a login. - Print. Opens a one-page printable version. Optimized for one sheet. Calm enough to leave on the kitchen counter for your child to glance at.
- Email. Sends the report to any address. Useful for forwarding to a teacher or coach who you want looped in but who will not download an app.
The share link does not expire. You can revoke it from your parent dashboard.
If you are looking at the report tonight and the score is lower than you expected, do not show it to your child tonight. Sleep on it. The report is not going anywhere.
How the Growth Score is calibrated
Every question in the Helix diagnostic is calibrated to a specific difficulty value on the same 100–300 scale your MAP report uses. Each answer updates the score estimate; the diagnostic ends when the estimate is confident enough. The math underneath is from the same family NWEA uses to score MAP. That is why the two numbers live on the same ruler.
So a Growth Score of 219 and a MAP RIT of 219 mean the same thing. If you want context on how RIT scores work across grades, see our explainer on what a MAP score actually means.
The report is the start of the work, not the end of it. The Growth Score names where your child is. The plan names what to do next. The Learning Map shows the shape of what is stable and what is still shaky. The projection shows what could change if the practice stays consistent.
If anything in the report ever stops feeling current (your child took the school MAP, the homework picture changed, the term ended), the free diagnostic is repeatable. Most families come back in three months. Some come back the week after a school MAP test.
The report is yours. So is the plan.
MAP® and RIT® are registered trademarks of NWEA. Helix Math is not affiliated with or endorsed by NWEA.