How to Read Your Child's MAP Math Score: A Parent's Guide
The score came home. Or it landed in an email at 9:47am with no warning, the way these scores tend to. And the parent move that comes next is almost always the same: a quiet calibration. Is this good. Should I be worried. Is my child behind. Is my child fine. Is my child too far ahead to need this. The number has not changed, but the questions stack up in seconds.
This guide is for that calibration.
What a MAP® score actually tells you. What it doesn't. And the three or four things worth doing this week, regardless of where the number landed.
Quick answer
A MAP RIT® score points at a direction, not a diagnosis. It estimates roughly where your child sits on a vertical scale that runs from kindergarten through high school. It does not tell you which specific skills are secure, which need review, or which are missing. The right next move depends on three readings of the score, not one: where it is relative to grade-level peers, which way it is moving across sittings, and what is underneath it at the strand and skill level. Below: how to read each, and the actual practice routine that closes gaps once you can see them.
What a MAP score actually tells you
NWEA's MAP test is one of the more carefully built assessment instruments in K-12 education. The RIT scale was designed to do one job well: estimate where a student sits, in math achievement, on a single continuous scale across many years of schooling. That is a placement and growth job. It is not a diagnostic job, and NWEA's own technical documentation is clear about the distinction.
What this means in practice. A RIT of 221 tells you, with reasonable confidence, that your child is performing somewhere around the middle of 6th-grade math. It does not tell you whether their fraction skills need review, whether they understand ratio conceptually or just procedurally, or whether they could explain why three-quarters is bigger than one-half if you asked them at the dinner table. Those questions are below the resolution of the score.
The four strand bars on the Family Report (Number and Operations, Operations and Algebraic Thinking, Geometry and Measurement, Statistics and Probability) add a little resolution, but only a little. Each strand is a directional summary of a small set of items, not a skill inventory.
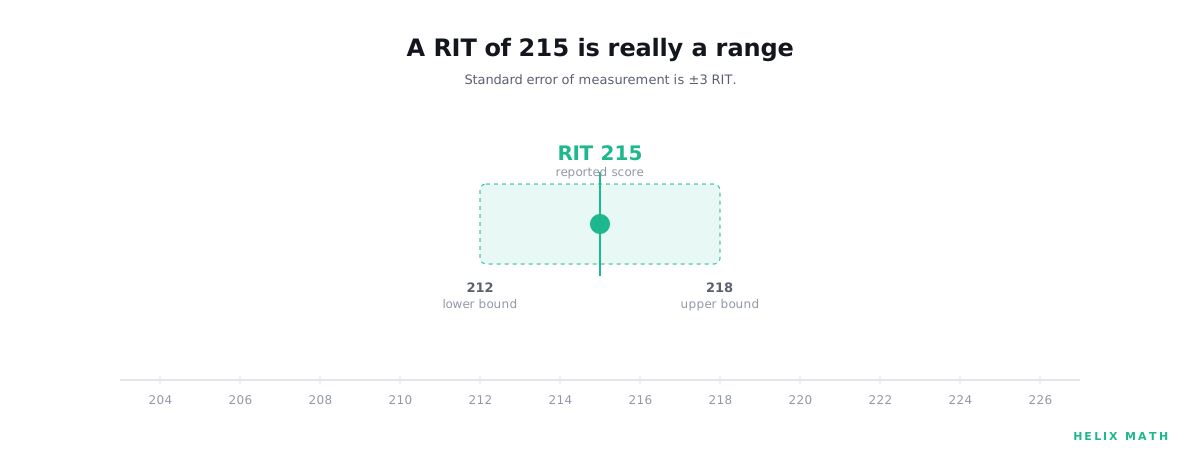
One more thing worth knowing. Every MAP score has a standard error of measurement of roughly 3 RIT for math. That means a reported score of 215 is really more like "212 to 218, with 68% confidence." Small score swings between sittings are usually inside this noise band, not signal. We will come back to this.
Reading the score: four scenarios
Almost every parent reading this is in one of four situations. The right move is different in each.
The score is below the grade-level median.
The instinct is alarm. The honest read depends on how far below, and on which strands are pulling the average down.
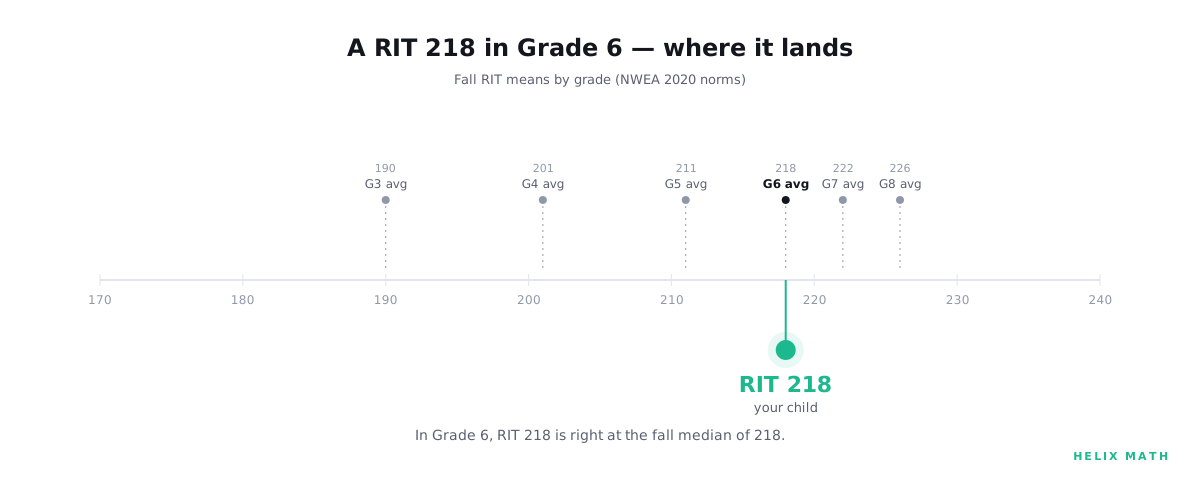
If the score is within roughly 3 RIT of the grade-level median, the gap is inside the test's measurement error. The "below the median" reading is barely defensible. A score of 218 in 6th-grade fall (median ~218 per NWEA's 2020 norms) is essentially "right at median." The interpretation is unchanged from on-grade-level.
If the score is 6 or more RIT below the median, there is likely a real signal underneath. The question is which skills are pulling the score down. Look at the strand bars. Strand asymmetry (one strand markedly lower than the others) is more informative than the overall score. A student at RIT 200 with a low Number-and-Operations strand and average Geometry is in a different position than a student at RIT 200 with the opposite shape. They need different practice.
The score is at the grade-level median.
The instinct is relief. The honest read is we still do not know what is underneath.
On-grade-level scores are exactly the band where the four mechanisms of gap-hiding live most comfortably. A student at the median is, by definition, average across what the test happens to sample. Average is composed of strengths and weaknesses that cancel out at the score level. The strand symmetry matters: do all four strands sit close together, or is one quietly under the others? The growth direction matters: is this child climbing or holding flat?
A median score that has been climbing steadily for two years is a different child than a median score that has been flat for two years. Both look identical on the report.
The score is above the grade-level median.
The instinct is satisfaction. The honest read is high scores hide gaps too.
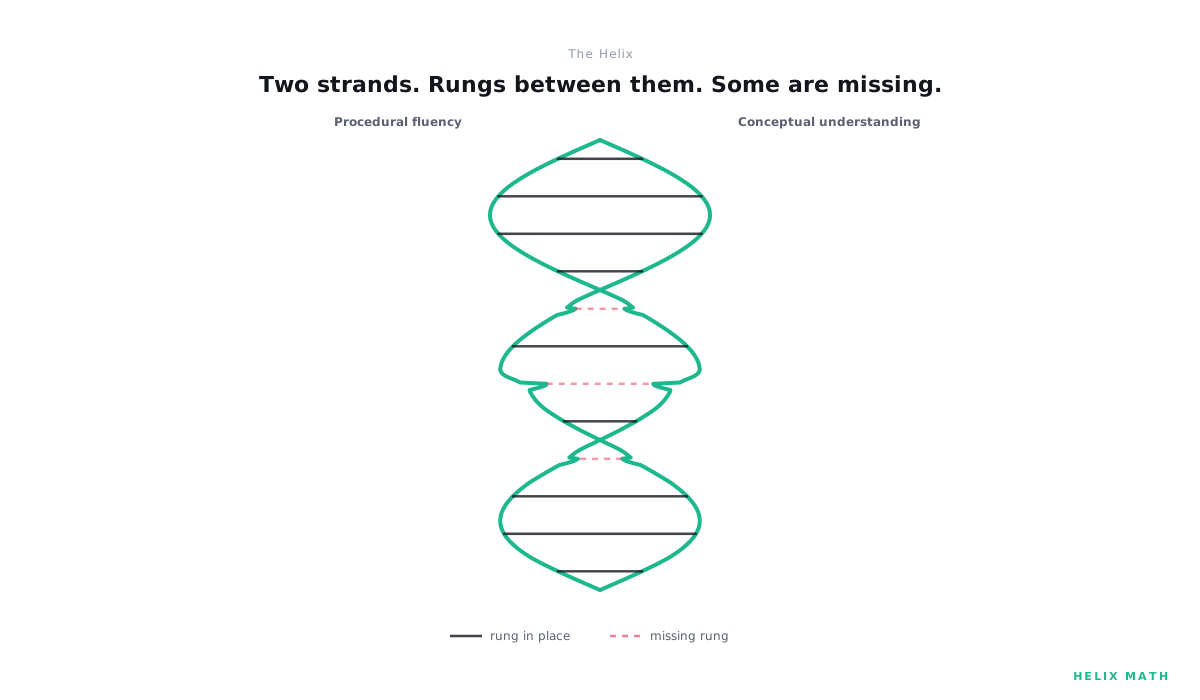
The literature is clear on this. Procedural fluency and conceptual understanding are dissociable: a student can move fast and confidently through trained problem types and still not survive transfer to a novel framing. This is the fluent-but-fragile profile, and it clusters quietly at the high-scoring end of the distribution. Algebra is structurally a transfer test. Fluent-but-fragile skills do not survive it.
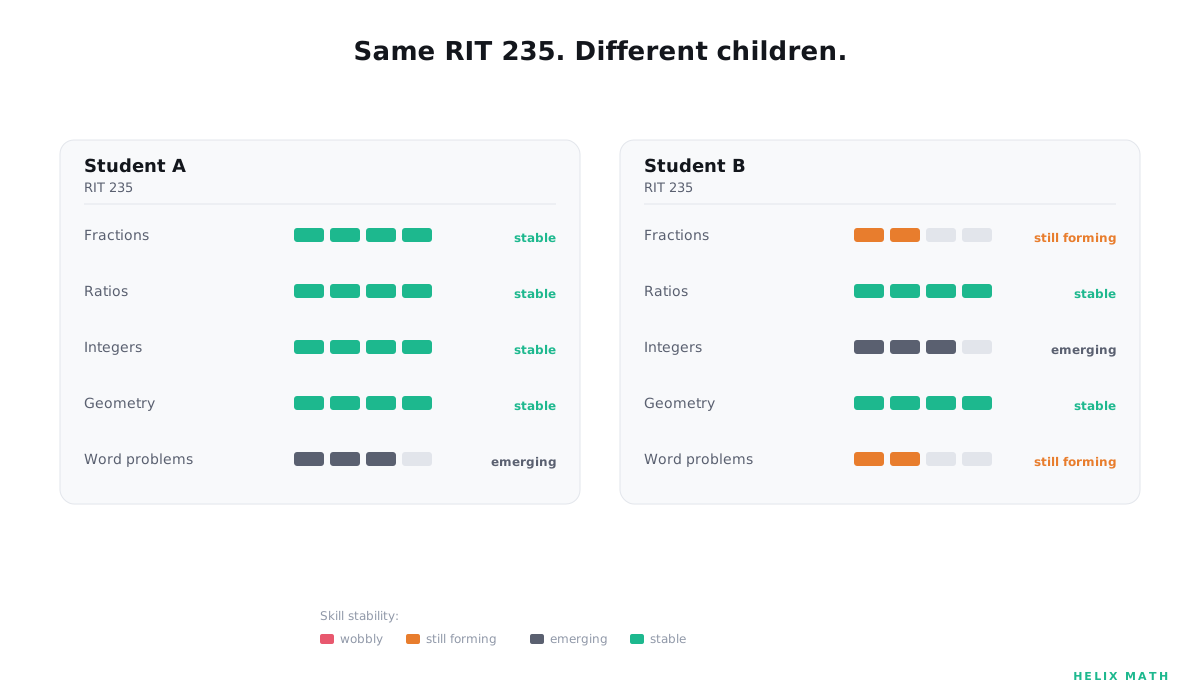
The strand bars are again the better read. Two students at RIT 235 can have very different futures. One has even mastery across all four strands. The other has strong Geometry and weak Operations, and is about to find pre-algebra much harder to work around. The score itself was not designed to tell them apart at the skill level.
The score dropped from last sitting.
The instinct is panic. The honest read starts with the noise band.
Within 3 RIT of the previous sitting: this is measurement noise, not a real change. NWEA's standard error guarantees that any test sitting could land 3 RIT above or below the student's true ability without anything having actually changed. Do not over-read.
Within 3 to 6 RIT: ambiguous. Look at strand-level changes. If one strand dropped sharply while others held, that is more diagnostic than the overall movement.
Beyond 6 RIT: probably a real signal. The next question is what kind of signal. A bad-day artifact (illness, distraction, test fatigue) presents differently from a real skill gap that has surfaced because the test moved into new material. Compare the spring form against the fall material; ask the school whether the curriculum has hit a new unit; look at which strand moved.
The practice that actually closes gaps
This part of the guide is where parents most often hear contradictory advice. The honest synthesis from the cognitive science and education-research literatures is short.
Practice should be short, distributed, and targeted on specific skills. Not random worksheets. Not the chapter the class is currently in. The skills the diagnostic flagged for review, twenty minutes at a time, four or five days a week.
The supporting evidence is consistent. John Dunlosky and colleagues, in a 2013 synthesis of the learning-techniques literature published in Psychological Science in the Public Interest, evaluated ten common study strategies and gave only two of them a "high utility" rating: practice testing (retrieval-based work, not re-reading) and distributed practice (short sessions spread across days, not crammed). Rereading, highlighting, and summarizing, the techniques most students naturally default to, received "low utility." The student who feels most confident after a session has often learned least.
Doug Rohrer and colleagues, in a series of studies on math practice specifically, have shown that interleaving (mixing different problem types within a session) produces substantially better long-term retention than blocking (drilling one type at a time). The interleaved condition feels harder in the moment. It works much better the next day.
Andre Nickow, Philip Oreopoulos, and Vincent Quan, in a 2020 meta-analysis of tutoring interventions across 96 randomized trials, found that targeted high-dosage tutoring produces a pooled effect size of roughly +0.37 standard deviations on student outcomes. For context, a year of conventional schooling produces about +0.30 SD. The literature is clear that targeted, frequent practice on the specific skills a student needs works. The literature is equally clear that which skills are being practiced matters more than how many minutes are logged.
The practical translation. Twenty minutes, four days a week, on the three or four specific skills that need review. Retrieval-based (the student attempts the problem; an explanation comes after, not before). Distributed across the week (not all on Sunday). Varied within the session (interleaved, not blocked).
The hard part is not the routine. The hard part is naming the skills. Most parents do not have skill-level resolution on their own child's mathematics, and the school's reports do not provide it either. (How to spot the four kinds of math gap a worksheet cannot see.)
What to do this week
A short list. If the score arrived this week, these are the moves that matter.
1. Look at the strand bars, not the score. Pull up the Family Report. Find the four strand bars (Number and Operations, Operations and Algebraic Thinking, Geometry and Measurement, Statistics and Probability). If one strand is markedly lower than the others, that is your starting place. The overall RIT is a summary; the strand decomposition is the first layer of resolution.
2. Check the direction, not just the level. Compare this sitting to the previous two or three. A flat score over multiple sittings is more concerning than a low score that is climbing. A high score that has been flat for two years is worth more attention than a high score that has been climbing.
3. Resist the worksheet impulse. The right answer to a low score is not more practice in general. The right answer is targeted practice on the three or four skills that are dragging the average. Without knowing which skills those are, more time spent practicing the wrong things leaves the same skills unfinished at higher cost.
4. Find the prerequisite skills underneath. Math is cumulative. A 4th-grade fractions gap becomes a 7th-grade ratio gap, and by 8th grade algebra is much harder to work around. The longitudinal research on this is unusually robust: a 2012 study by Robert Siegler and colleagues, working with two large national datasets, found that elementary-school knowledge of fractions and whole-number division was the strongest single predictor of high-school math achievement, even after controlling for IQ, working memory, and family background. The skills that matter most are not the ones the test is currently sampling; they are the ones underneath it. (Why fractions are the fault line for almost every later math gap.)
This is also the move where most parents need help. Naming three specific skills out of the hundreds your child has been exposed to, in the right order of leverage, is the work of an interpretation layer between the score and the skills. That layer is the job a diagnostic does that a single MAP score cannot.
The score is the starting point, not the verdict.
A MAP score is the most reliable signal you currently have about where your child is in math. It is also a number that has been carefully designed to not tell you which skills need review underneath it. Both things are true at once.
The work is the same regardless of which scenario the number landed in. Find the strands that need attention. Find the three or four skills underneath those strands that the next two years of math will lean on. Practice them for fifteen to twenty minutes a day, four days a week, retrieval-based and interleaved. Watch for whether the skill holds up over time, not single-session accuracy. Reread this guide if the next score swings.
If you want help finding the specific prerequisite skills in your child's case, the Helix Program is built to do exactly that, across all four ways gaps stay invisible. It begins with a 30 to 40 minute diagnostic and produces a skill-level map of which skills are in place and which are not, designed to be read alongside the MAP report. You can read more about the approach at Helix Math.
The score is the starting point, not the verdict. The rest is the work you were already willing to do.
MAP® and RIT® are registered trademarks of NWEA. Helix Math is not affiliated with or endorsed by NWEA.