The average hides the gaps
Your sixth grader scored a 221 on fall MAP® math. The percentile came back at 58. Solidly "on grade level." The report said "keep doing what you are doing." But three weeks into the school year, she is in tears over ratio homework. The teacher says she is "behind on proportional reasoning" and might need extra support. You are holding a score that says "generally on track" and a lived experience that says "something is still unstable." Both can be true.
The short answer
- A composite math score averages together performance across four or five skill strands. Two students with the same composite can have completely opposite strand profiles. One strong in algebra but needing review in fractions, the other reversed.
- "On grade level" overall does not mean "on grade level in every skill." A single weaker area (especially ratios, fractions, or algebraic thinking) can sit underneath a strong composite for a year or more while the gap carries forward.
- The MAP report includes strand-level scores (called "RIT® Scores by Instructional Area" or "Goal Scores"), but many parents only receive or notice the one-page summary. Those instructional-area scores are where the skill picture becomes visible.
- If the composite looks fine but your child is struggling in class, ask for the instructional-area breakdown. As a practical rule of thumb, a persistent 10+ point spread between instructional areas is worth asking about. A persistent 15+ point spread deserves closer review, especially when it matches what you see in class or homework.
How a 221 can mean two completely different things
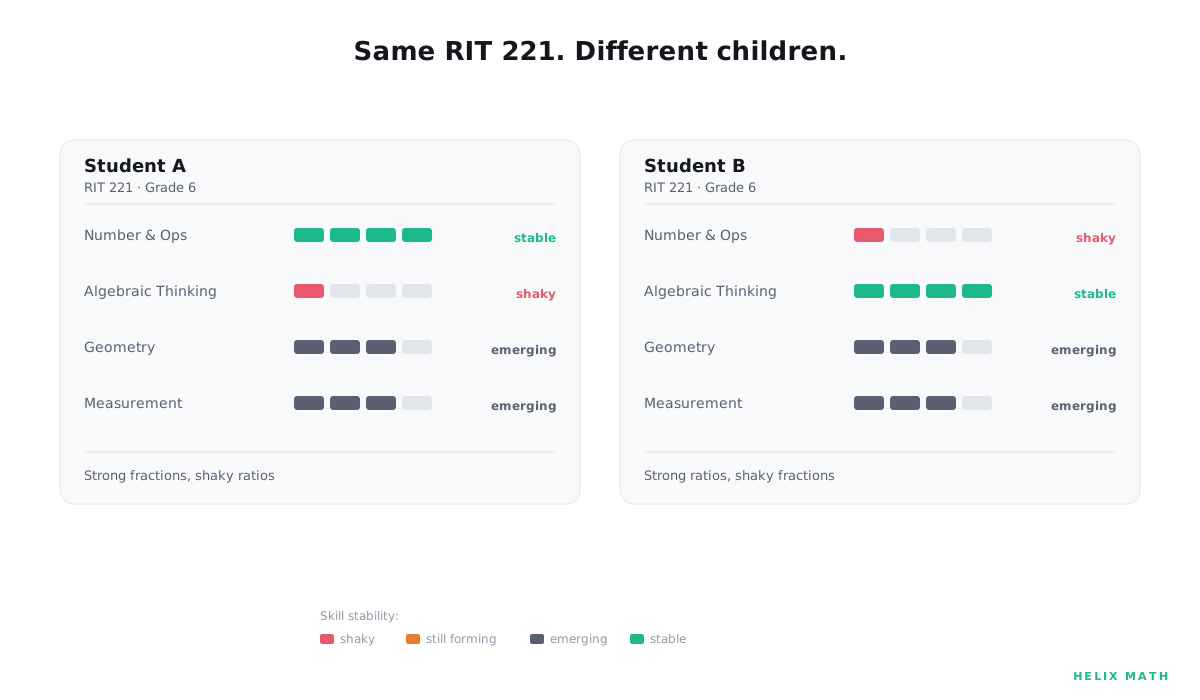
Two sixth graders walk into fall MAP testing. Both finish with a math RIT of 221. The composite puts them both at the 58th percentile. National norms say they are performing identically. Their seventh-grade algebra teachers will tell you they are not even close.
Student A is strong in Number and Operations. Her RIT in that strand is 235. Fractions, decimals, whole-number operations. All solid. But her Operations and Algebraic Thinking strand sits at 205. Ratio reasoning, proportional relationships, early work with expressions. Not yet secure. She passed sixth grade on the strength of her calculation skills. The composite held steady. In seventh grade, when the curriculum builds on ratios (6.RP.A.3, unit rate reasoning), she runs into a real obstacle. By eighth grade, she may be seen as not yet ready for algebra. The weaker area was visible in sixth grade. The composite, on its own, did not surface it.
Student B is the inverse. Operations and Algebraic Thinking: 238. Pattern recognition, ratio work, early variable manipulation. Strong. Number and Operations: 208. Fraction equivalence and decimal operations inconsistent. She succeeds in seventh-grade algebra-adjacent work. She stumbles on fraction-heavy units. The teacher places her in algebra, trusting the composite. In ninth grade, when rational expressions appear, the fraction gap surfaces. She thought she was behind. She was not. She had a specific missing piece that the composite never showed.
The composite summarizes the pattern. It does not preserve all the variation underneath. The algebra teacher does not average. The curriculum does not average. The skill progression is not forgiving of holes.
What a composite math score actually is (and the hidden gaps it erases)
A composite math score is a weighted combination of performance across four domains: Operations and Algebraic Thinking, Number and Operations (called "The Real and Complex Number System" in upper grades), Geometry, and Measurement and Data. NWEA samples across all four. The student sees roughly 50 questions total, distributed unevenly. The composite is the best estimate of "general math achievement." But "general" is doing a lot of work.
An average hides variance by design. That is its job. You add the high scores and the low scores and divide. The result erases the difference between them. In psychometrics, this is a feature, not a bug. Composite scores are steady. They track growth cleanly. They place students in a national context. But the variance they erase is exactly where the gaps live.
Two students can arrive at a RIT of 220 via completely different strand combinations. One might score 230 in Number and Operations, 225 in Geometry, 215 in Algebraic Thinking, and 210 in Measurement. Another might score 218 across all four strands. The composite calls them the same. The skill map underneath them is not.
The table below shows four sixth graders, all with a composite RIT of 220 in fall. Look at the strand breakdown.
| Student | Composite | Number & Ops | Algebraic Thinking | Geometry | Measurement |
|---|---|---|---|---|---|
| A | 220 | 235 | 205 | 220 | 218 |
| B | 220 | 208 | 238 | 218 | 215 |
| C | 220 | 218 | 219 | 221 | 222 |
| D | 220 | 208 | 225 | 228 | 212 |
Student C is even across strands. Students A, B, and D are not. The composite alone cannot tell you which student is which. The instructional-area scores may offer clues, and a skill-level diagnostic can go further.
The MAP composite can tell you a 221. The instructional-area scores add useful direction. The skill-level picture, the question of whether the student is 221 because of strong geometry and fractions that need review, or strong fractions and algebraic thinking that needs review, sits at a finer resolution. That finer answer is the one that shapes what happens next year.
Here is what that layer looks like for a real student: an anonymized Helix diagnostic report showing the skill profile underneath the score.
The sixth-grade ratio gap that decides eighth-grade algebra
A student exits fifth grade with a composite RIT of 215. The percentile is 55. "On grade level." The teacher says she is doing fine. The MAP Family Report includes strand scores. Number and Operations: 230. Strong. Operations and Algebraic Thinking: 198. Not strong. The specific skill missing: 6.RP.A.3, unit rate reasoning. The parent does not see the strand breakdown. The school sends home a one-page summary with the composite only.
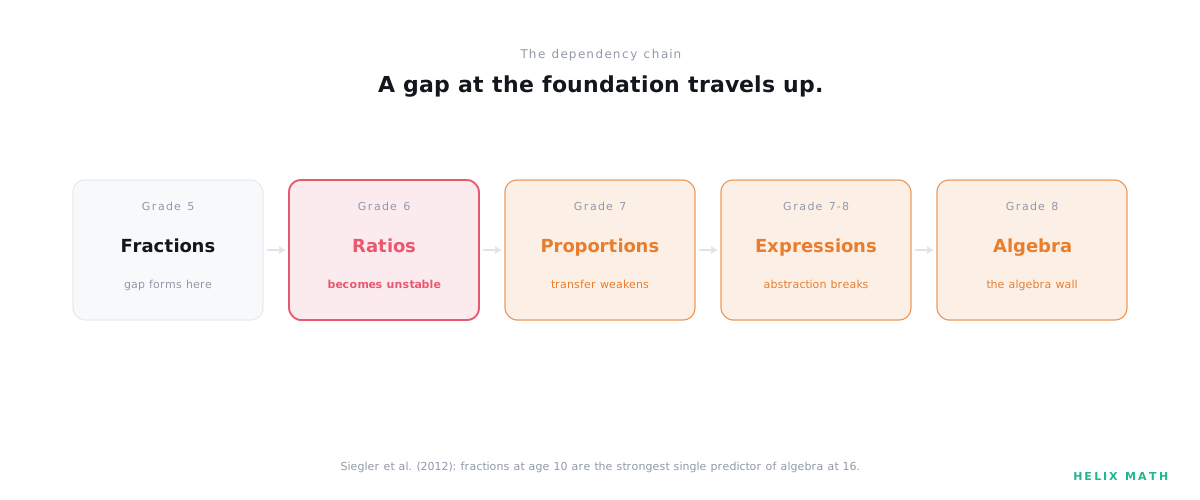
In sixth grade, the curriculum covers 6.RP. Ratios and proportional relationships. The student stumbles through the unit. The teacher offers extra help. The student passes the year because her fraction work (still strong) carries her through the composite. Fall of seventh grade, the MAP composite is 218. Still "on grade level." The percentile has dipped to 50, but that is within normal variation. No alarm bells.
Seventh-grade math builds on sixth-grade ratios. The standard is 7.RP.A.2: recognizing and representing proportional relationships. The student cannot. The foundation was not secure a year ago. Now it is missing entirely. The teacher notices. The parent is confused. "She scored fine on MAP." The composite did score fine. The composite is an average. A gap in one strand does not pull the composite down immediately. It pulls it down slowly, over multiple years, while the student falls further behind in the specific skill progression that gap interrupted. By the time the composite drops, the gap is two years deep.
By eighth grade, the placement decision is between pre-algebra and algebra. The composite has dipped to the 42nd percentile. The student may be seen as not yet ready for algebra. The parent asks when the gap started. In this example, the signal first became visible around sixth grade, in the instructional-area scores. The composite, on its own, did not surface it.
This is not an unusual story. This is how math gaps compound when left unaddressed. The progression is predictable: an unfinished 6.RP becomes a stumble in 7.RP, and by 8.EE (expressions and equations) it is much harder to work around. The instructional-area scores carried the signal at the source. The composite, on its own, did not.
Where the strand scores live: the composite math score hidden gaps most parents never see
The MAP Family Report includes strand-level scores under a section labeled "RIT Scores by Instructional Area" or "Goal Scores," depending on the report version. These are the four or five bars showing performance by domain. Each bar has its own RIT. This is the resolution where gaps become visible.
Many parents only receive or notice the one-page summary, even though more detailed instructional-area information may be available through the school. The full Family Report or Student Profile Report is the document worth asking about.
Schools have discretion over which version of the MAP report gets sent home. Some schools send the full multi-page Family Report. Others send a condensed summary with only the composite score and percentile. If you received a single page with one number and no breakdown, you likely did not get the full report. In many cases, the school can provide a fuller MAP report or student profile with instructional-area information. Call or email the school office and ask for "the full MAP Family Report, including instructional-area scores."
Once you have the fuller report, look at the strand bars. Each one shows a RIT for that instructional area. Compare them. A 5 to 10 point spread between the highest and lowest is within normal variation. As a practical rule of thumb, a persistent 10+ point spread is worth asking about. A persistent 15+ point spread deserves closer review, especially if it matches what you see in class or homework.
A caveat on resolution: instructional-area scores are useful directionally, but they are based on fewer items than the overall score and can be more variable. NWEA's 2024–2025 technical report notes that instructional-area scores generally provide reliable directional measurement, with greater variability at narrower instructional-area levels. Treat one large imbalance as a question, not a conclusion. A pattern across two test windows (fall and spring, or spring and the following fall) is closer to signal.
If you see a persistent strand imbalance across multiple test windows, especially one that matches classroom experience, it is worth investigating further. The next step is to figure out which specific skills in that area are not yet secure.
What you can do this week
Four actions. None of them require waiting for the school.
One. Ask for the fuller MAP report if you only have the summary. Call the school office or email your child's teacher. Ask for "the full MAP Family Report, including RIT scores by instructional area." In many cases the school can pull this from the reporting tools.
Two. Look at the instructional-area scores, not just the composite. Flag any strand that is persistently 10 or more RIT below the others. Write down which strand it is and what the RIT gap is.
Three. If you see a significant imbalance, ask the teacher which specific skills in that strand your child struggled with during the last unit. Frame it as a question, not a concern. "Her Number and Operations strand is 15 points below the others. Which fraction or decimal skills came up in class that she might need more practice on?" A good teacher will have an answer. If the teacher does not, the question itself is useful. It signals that you are paying attention to the skill level, not just the score.
Four. If the teacher cannot name specific skills, or if the school does not break down strand-level work, consider running a skill-level diagnostic yourself. That is what Helix Math was built to do. The Helix Program begins with a diagnostic designed to surface which skills appear secure, are still developing, or may need more attention within each area of math. It takes 30 to 40 minutes and maps the skill picture underneath the number. For a quicker first read, a free no-login practice check by grade (free grade 5 practice problems, free grade 7 practice problems) shows where a strong average can still hide a skill that needs review.
The number alone will not tell you
The composite is useful. It tracks growth. It places students in a national context. But summaries compress variation. The detail is where the gaps live.
Two students can score the same 221 for completely different reasons. One may be headed for algebra success. One may be headed for the longer route. The composite, on its own, will not tell you which is which. The instructional-area scores can offer direction. A skill-level map gives the finer picture.
If your child's composite says "generally on track" but their homework says something else, you are not imagining it. The instructional-area scores may already be pointing at the area that needs review. The MAP report does not bury the information. It just does not put it in the headline.
The score did not change your child. The skill map did not change. What changed is that you can now see it.
MAP® and RIT® are registered trademarks of NWEA. Helix Math is not affiliated with or endorsed by NWEA.