What is the Helix Growth Score? The 100-300 ladder
Your child finished the diagnostic. The report loaded. The first thing your eye lands on is a green number, somewhere between 100 and 300, sitting on a horizontal ladder of grade bands. That number is the Helix Growth Score, and it carries more meaning than its size suggests.
This post is about that one number. What scale it sits on. Why it runs from 100 to 300 instead of 0 to 100. What it actually measures and what it deliberately does not. How it lines up with a MAP® RIT® score. And what would have to happen for it to change. If you want the section-by-section tour of the rest of the report, see how to read your Helix diagnostic report. This piece stays inside the score itself.
What the Helix Growth Score actually is
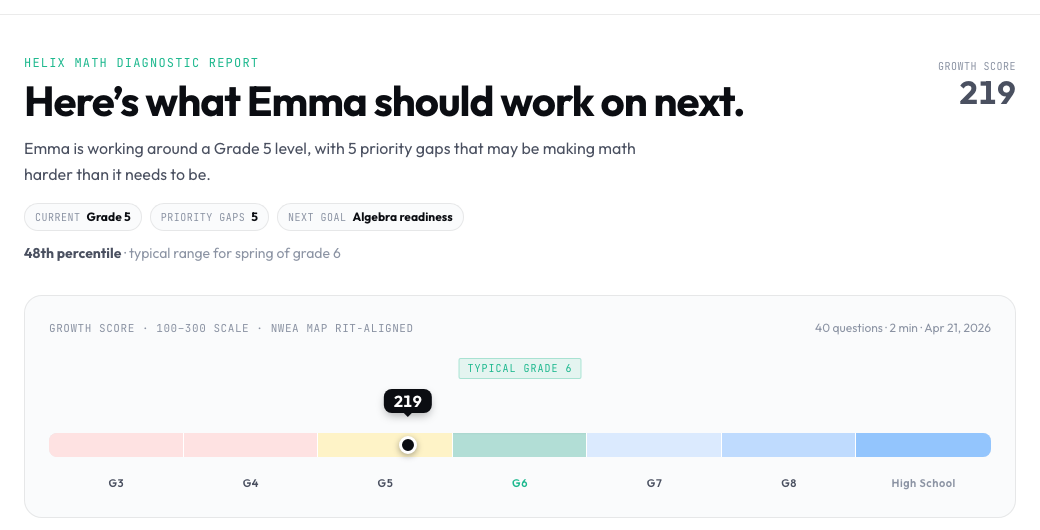
The Helix Growth Score is a single number, between 100 and 300, that names where your child currently sits on the math curriculum. It is not a percentile. It is not a percent correct. It is not a letter grade. It is a point on an equal-interval ladder where each step up represents roughly the same amount of math learning, regardless of whether your child started the test at 180 or 240.
The score comes from the diagnostic itself. Every question in the Helix question bank is calibrated to a specific difficulty value on that same 100 to 300 ladder. As your child answers, the engine updates its estimate of where they belong on the ladder. The diagnostic ends when the estimate is confident enough, usually after 35 to 40 questions. The final estimate is the Growth Score.
A Growth Score is descriptive, not evaluative. It does not say your child is "behind" or "ahead." It says: on this ruler, your child is here. Where "here" sits relative to grade level is a separate question, answered by the colored bands behind the score and the strand bars below it.
Why the scale runs from 100 to 300 instead of 0 to 100
A 0-to-100 scale would be intuitive. We chose 100 to 300 anyway, for the same reason the standardized-testing field chose it forty years ago.
The 100-to-300 scale is the same scale NWEA uses for the MAP RIT score. Built on the same item-response-theory mathematics. Calibrated against the same grade-level norms. A Helix Growth Score of 215 lives on the same point of the same ruler as a MAP RIT of 215. We did not invent a new scale. We adopted the one that 14 million U.S. students are already measured on every year, so the number on your Helix report and the number on your child's school MAP report can be read against each other directly.
The scale has three practical properties:
- Equal intervals. Moving from 200 to 210 represents the same amount of math learning as moving from 230 to 240. A 0-to-100 percent-correct scale does not have this property; a percent of 50 to 60 is not the same kind of jump as 85 to 95.
- No ceiling near grade level. The ladder runs well above an 8th-grader's typical range, so a student who is well above grade level still has room to grow on the same scale. A grade-level test that tops out at 100% cannot show what comes next.
- Comparable across grades. A 215 in 4th grade and a 215 in 7th grade are the same point on the ladder. The interpretation changes (a 215 is strong in 4th, behind in 7th), but the number itself is grade-neutral.
The cost of a 100-to-300 scale is that it is unfamiliar. The benefit is that one number works from elementary through high school and lines up with the score your child is already getting at school.
What a Growth Score does and does not tell you about your child
A Growth Score tells you, in one number, where your child currently sits on the curriculum ladder. That is genuinely useful. It is also genuinely incomplete.
The Growth Score tells you:
- A current level on a Helix Growth Score scale designed to be interpretable alongside MAP RIT.
- The grade band that level falls inside (G3, G4, G5, G6, G7, G8, or HS).
- A relative position against same-grade peers (the percentile shown next to the score).
- Whether your child sits below, at, or above their own current grade level.
The Growth Score does not tell you:
- Which specific skills are stable and which are still forming. Two students at the same 215 can have completely different skill profiles.
- Whether the gaps your child has are in fractions, decimals, ratios, or proportional reasoning.
- Whether the score reflects fluency, conceptual understanding, or both.
- Whether the score is trending up, flat, or down. One number is one moment in time.
This is the single most important thing to understand about any score on this kind of scale. The average hides the gaps. A 218 averaged across four math strands tells you the average. It does not tell you that Numbers might sit at 235 and Geometry at 198. The score names a level. The work happens one skill below the score.
The diagnostic report addresses this directly. Underneath the Growth Score, the four strand bars split the number into Number Sense, Operations & Algebra, Geometry, and Statistics & Probability. The Plan and the Learning Map go a layer deeper, all the way down to specific Common Core skills. The Growth Score is the headline. The skills below it are the story.
How to read the Growth Score alongside a MAP RIT
If your child has taken NWEA MAP® at school, you have seen a three-digit RIT score between 140 and 280, sitting next to a grade-level band and a percentile.
The Helix Growth Score is intentionally calibrated toward familiar MAP-like ranges, so families can read the two side by side. The math underneath both numbers is from the same family of psychometric techniques (Rasch / item response theory). Helix and MAP are not equated, and Helix has not performed formal score-linking studies against NWEA's norming sample. The two scores are designed to be interpretable alongside each other, not psychometrically interchangeable.
What "interpretable alongside" means in practice:
- Sampling noise. Any single test produces an estimate, not a fixed truth. Two MAP tests a week apart can vary by 3 to 5 points on the same student. The same is true of a Helix diagnostic. If your child's Helix score is 218 and the MAP score is 222, those are not contradictory. They are two estimates of the same underlying ability.
- Different question banks. Helix and MAP draw items from different banks. Helix's bank emphasizes the skill-level diagnostic items the engine needs to identify shaky skills. MAP's bank emphasizes broad coverage for placement and growth reporting. The ranges are designed to be readable together; the instruments are not identical.
- Different intent. MAP is built for broad academic measurement and growth tracking. Helix is built for skill-level interpretation underneath that measurement. Different layer of resolution, different question.
For most parents, the practical implication is simple: if you saw a 221 on your child's MAP report last fall, expect the Helix Growth Score to land somewhere in the same general neighborhood. If it does, the picture is consistent with what the school already told you. If it does not, the most likely reason is genuine month-to-month variation, not a problem with either instrument.
MAP® and RIT® are registered trademarks of NWEA. Helix Math is not affiliated with or endorsed by NWEA.
What the colored bands behind the score mean
The horizontal ladder under the Growth Score is shaded in five colors, and the shading is doing more work than the casual eye notices.
- Red. The score sits two or more grade bands below your child's current grade. A real gap. The plan exists to close it.
- Amber. One grade band below. Approaching grade level, not yet there.
- Green. On grade level. The most common position, by definition.
- Blue (lighter). One grade band above.
- Blue (darker). Two or three grade bands above. Genuine headroom.
The bands are not absolute color codes. They are relative to your child's current grade level. A Growth Score of 215 lands in red for a 7th-grader, green for a 5th-grader, and blue for a 4th-grader. Same number, three different stories. The shading turns a context-free RIT into a contextual reading without forcing you to memorize which grade typically sits where.
This is the part most MAP reports do not do. They give you the number and the percentile, then leave the band interpretation to a footnote. The colored ladder is the visual translation of "where does this number actually sit for my child."
When the Growth Score changes (and when it does not)
A Growth Score changes when the underlying skill picture changes. Practice that builds genuine mastery moves the score up. Worksheet drilling without comprehension does not.
Specifically, the score updates when:
- Your child takes a new diagnostic. Most families come back every three months, or the week after a school MAP test. The diagnostic is repeatable.
- Your child practices through the Helix engine and the engine confirms a skill is stable. Each confirmed mastery raises the engine's internal estimate of your child's ability.
- Helix detects a previously-unstable skill is now consistently correct across multiple sessions and difficulty levels.
The score does not change in these cases:
- A single good practice session. One day of strong answers is not yet a stable skill.
- Reading the report. The Growth Score is a snapshot at the moment of the diagnostic.
- Time alone. Math gaps do not heal themselves. The score sits where it sits until the underlying skills move.
What you should expect, at a reasonable Helix pace (about 10 to 20 minutes a day, four or five days a week), is roughly the same growth that NWEA's published norms describe for high-dosage tutoring. The 9-month projection underneath the score models three commitment levels and shows the expected Growth Score nine months from now at each level. That projection is calibrated from NWEA's 2020 growth norms and a peer-reviewed meta-analysis of intensive tutoring effects (Nickow, Oreopoulos & Quan 2020). It is a model, not a guarantee. Consistency is the variable that matters.
If your child practices and the score does not move at all over three months, something is off. Either the practice is not landing (a different problem, often a coaching one), or the gaps the engine is targeting are not the gaps that are actually shaky. Both are fixable, and both are worth a closer look at the strand bars and the Learning Map.
How to share the score with a teacher or tutor
The score is portable. The share icon at the top of the report generates a public link, helixmath.com/r/<token>, that opens the same report without requiring a login. You can send it to a teacher, a tutor, a co-parent, or anyone you want looped in on what the diagnostic found. The link does not expire. You can revoke it from your parent dashboard at any time.
For a teacher conversation, the most useful thing to share is not the Growth Score in isolation. It is the Plan and the Learning Map. The Growth Score names the level. The Plan and the Map name the specific skills. A teacher can act on a skill list. A teacher cannot act on a single number.
The Growth Score is a starting point, not a verdict. It tells you, in one number, where your child sits on the same ladder the school is already using. What it does not tell you is what to do about it. That is what the rest of the report is for.
If you want to see the score for your own child, Helix Math offers a free diagnostic that takes 30 to 40 minutes and returns the same Growth Score, the four strand bars, the Plan, and the Learning Map, all in one place. Most families take it on a weekend morning after a MAP report has come home.
The number is the start of the conversation. The skills underneath it are the work.
MAP® and RIT® are registered trademarks of NWEA. Helix Math is not affiliated with or endorsed by NWEA.