How to read your child's MAP score report, step by step
The report came home in a folder, or as a PDF link, or a screenshot from another parent. There is a number near the top, a percentile beside it, a small chart, and a cluster of bars further down that you skimmed past. You read the number, felt relieved or uneasy, and filed it. A week later your child is stuck on homework the report said was fine. Most explainers on how to read MAP® score report sections start with definitions. This one starts with the order, because the order is the part no one shows you.
The short answer
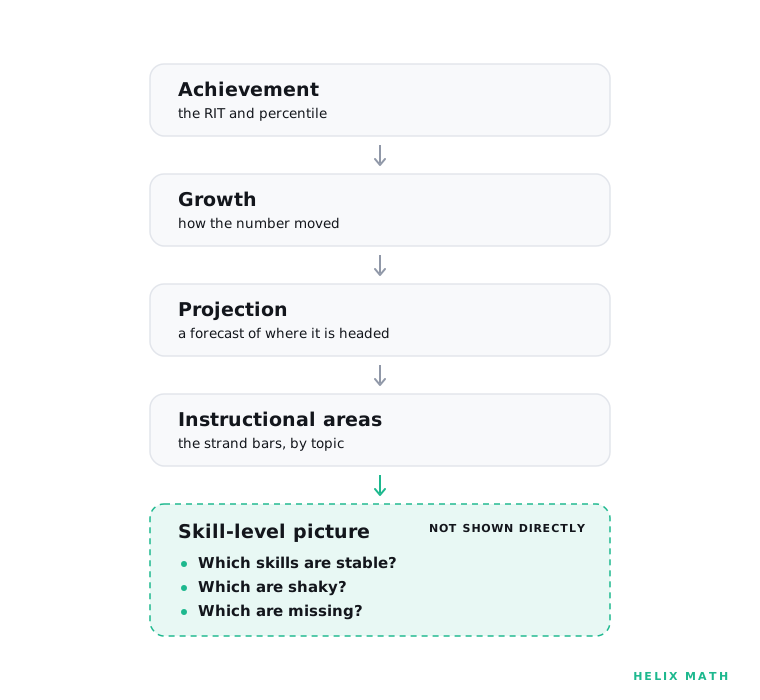
- The MAP Growth Family Report shows four different things: achievement (the RIT® and percentile), growth (how the number moved), projections (a forecast), and instructional areas (the strand bars). They answer different questions and should not be averaged in your head.
- The big number, the RIT, is an estimate on a vertical scale. The percentile next to it compares your child to same-grade peers. Neither one is a grade or a measure of mastery.
- Small score swings are usually inside the test's measurement error. A 3 or 4 point change, on its own, is rarely a real shift.
- The report is precise about where your child sits and much vaguer about why. The strand bars hint at the why but stay at a broad resolution.
- Read on for what each section means, and which numbers actually deserve your attention.
The four things every MAP report is actually showing you
The MAP Growth Family Report is one page trying to do four jobs at once. NWEA, the nonprofit that makes the test, is direct about what it is not. In their own words, "the RIT score is not a grade, and the MAP Growth Family report is not a report card. It's not an assessment of mastery, it's not one and done, and it's not make or break" (NWEA Family Report guide).
So what is it? Four separate measurements, printed together:
- Achievement. The current RIT score and the percentile beside it.
- Growth. How the RIT changed between two test windows.
- Projections. A forecast of where the score is headed.
- Instructional areas. The strand bars, broken out by math topic.
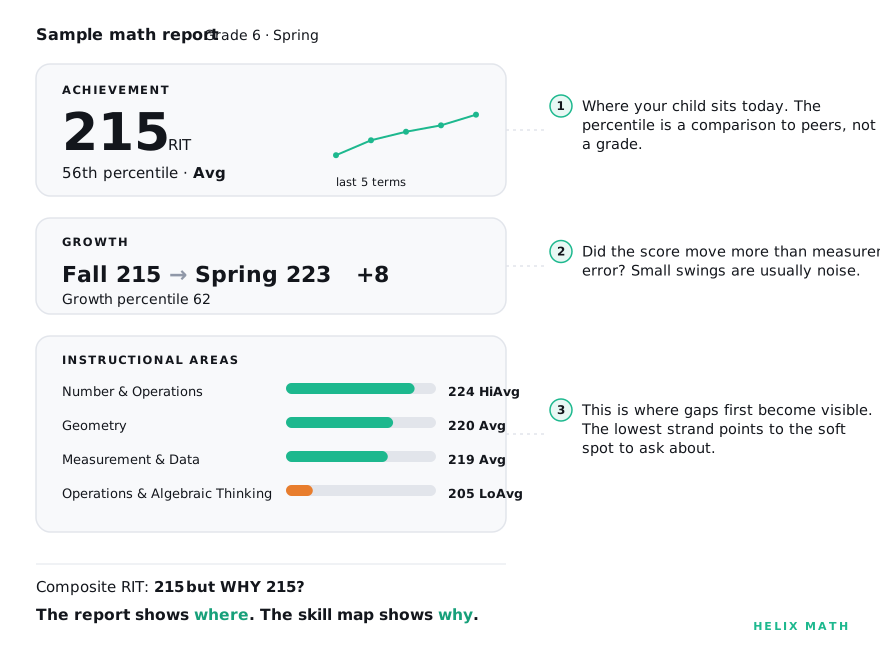
Each one answers a different question. The most common reading mistake is to glance at the top number, form a verdict, and never scroll to the part that would have told you something useful. Read them in order, and read each one for what it is.
But hold one thing in mind before you start. The report is good at telling you where your child sits. It is much less precise at telling you why they sit there. Each section below sharpens the where. None of them fully answers the why. That missing layer, the specific skill underneath the score, is the most important thing on the page, and it is the one part the report cannot print.
Start with achievement: the RIT and the percentile
The RIT is the large number near the top, usually somewhere between 140 and 250 for a grade 4 through 8 student. It is an estimate of achievement on a vertical scale, which is a fancy way of saying the scale runs continuously across grades, so a 215 means the same level of difficulty in fourth grade as it does in seventh. The number does not reset each year. That is what lets the test track growth over time.
Next to the RIT sits the percentile. This is the one parents misread most often. A percentile of 58 does not mean your child got 58% of the questions right. It means they scored higher than 58% of same-grade students in the national comparison group. Half the country sits between the 25th and 75th percentile. That is the normal middle, and most children live there.
NWEA labels percentile ranges with five descriptors. They appear on some report versions and are worth recognizing.
| Descriptor | Percentile range |
|---|---|
| Lo | below 21st |
| LoAvg | 21st to 40th |
| Avg | 41st to 60th |
| HiAvg | 61st to 80th |
| Hi | above 80th |
One quiet detail matters here. Percentiles move when NWEA re-baselines its norms. When the 2025 norms replaced the older set, NWEA noted that a score that previously landed a student at the 50th percentile would now place them at the 56th, with no change in actual achievement (What's new in the 2025 norms). The child did not change. The reference group did. If your child's percentile shifted between years, check whether the norms changed before you read it as progress or decline.
Then growth: did the number move, and does the move mean anything
Growth is the change in RIT between two valid test windows, usually fall to spring. This is the section parents fixate on, and it is also the one most distorted by a single fact: every score carries measurement error.
MAP's standard error of measurement in math is about 3 RIT points (NWEA on standard error). That means a reported 215 is really "somewhere around 212 to 218, with about 68% confidence." Widen that to 95% confidence and the band runs roughly 209 to 221. The number you were handed is the center of a range, not a fixed point.
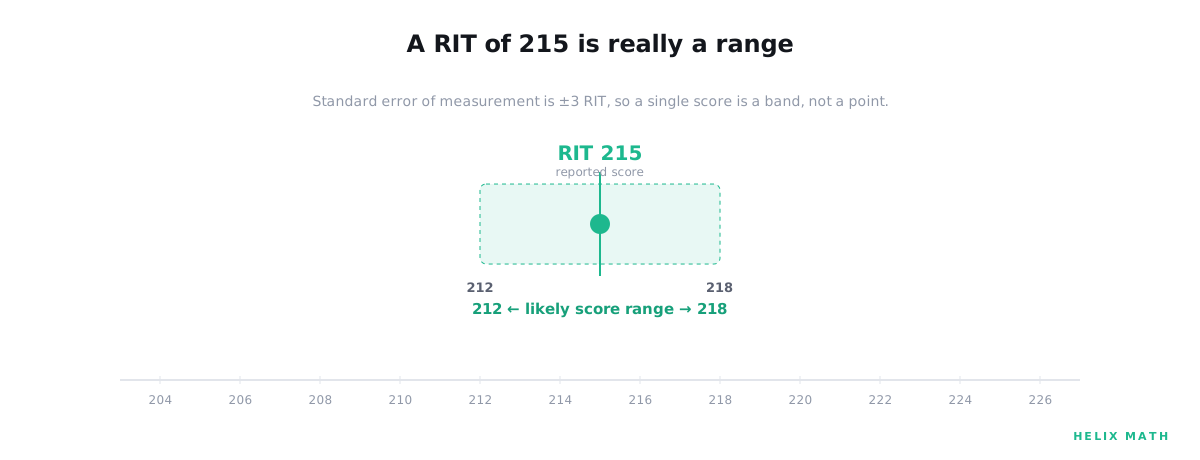
This changes how you read small movements. A student who scored 188 in fall and 190 in winter has not necessarily made measurable progress. The two-point gap is inside one standard error. The same is true in reverse. A single five-point drop is plausibly noise, not a warning. As a rough rule of thumb, small changes inside roughly two standard errors usually need more context before they are read as a real shift.
If your child's report includes a growth percentile or a conditional growth percentile, that figure is often more useful than the raw point change. It compares your child's growth to students who started at a similar place, which separates how far they traveled from where they began. A conditional growth percentile of 50 is typical progress. Above 75 is top-quartile growth, even if the absolute score is still below the grade average.
The projections: a forecast, not a verdict
Many reports include a projected RIT for upcoming terms, and sometimes a projected proficiency level on a state test. Read these the way you read a weather forecast. They are reasonable estimates based on how similar students have grown, and they are useful for setting expectations. They are not a ceiling, and they are not a promise. A projection assumes the current trajectory holds. Trajectories change, in both directions, all the time. Do not let a projection become a label your child has to live up to or down to.
The instructional areas: where the report quietly gets useful
Scroll past the projections and you reach the part most parents skip: the instructional areas, sometimes called goal scores or strands. For math, these break the single RIT into separate scores by topic. The exact names depend on the test version and grade, but they usually include some version of:
- Operations and Algebraic Thinking
- The Real and Complex Number System, or Number and Operations in earlier grades
- Geometry
- Measurement and Data
- Statistics and Probability
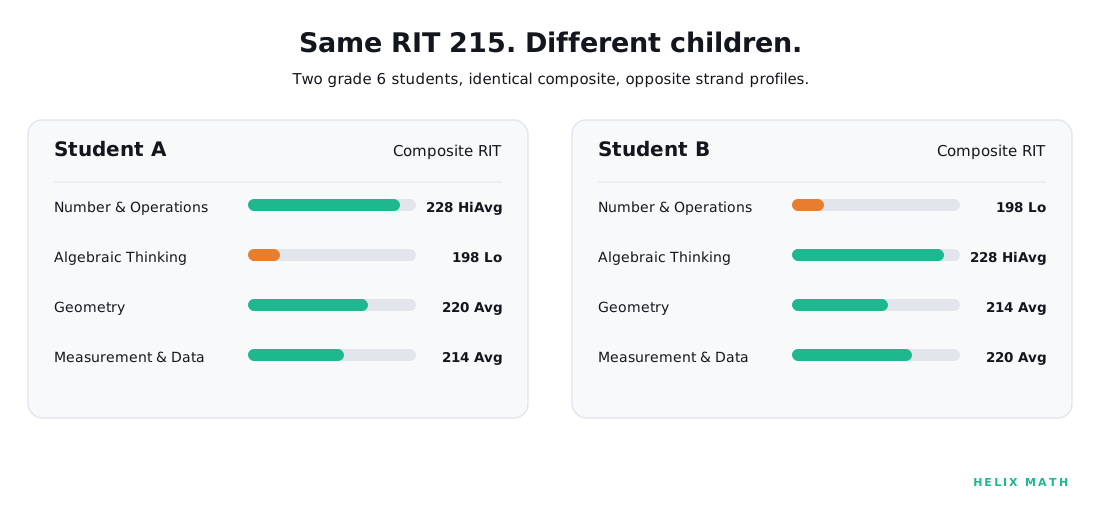
This is the most informative part of the report, because the overall RIT is an average across all of these. An average hides the spread. Two children with the same composite RIT can have completely different strand profiles, one steady in number sense and needing review in algebraic thinking, the other the reverse. The composite calls them the same. The strands begin to tell them apart.
If you want to go deeper on why a single score can hide so much, the average hides the gaps walks through it in full.
Here is the honest limitation. Each strand score is built from far fewer questions than the overall RIT, so it carries a wider margin of error. NWEA itself recommends interpreting these sub-scores with caution and not making instructional decisions on a single one (NWEA on reliability). Treat a single low strand as a question, not a conclusion. A pattern that repeats across two test windows, and matches what you see in homework, is closer to a real signal.
So the strand bars point you toward the right neighborhood. They tell you that algebraic thinking might be the soft spot. They do not tell you whether the skill that needs review is unit rates, or writing expressions, or solving two-step equations. That finer picture lives at a resolution the report was not designed to reach.
What the report is not telling you
A MAP report is a broad achievement measure taken under standard conditions. It is genuinely good at what it does. But it answers a broader question than the skill-by-skill one, and knowing where that line falls keeps you from over-reading the page.
It does not measure effort. If your child rushed or guessed through a section, the score understates what they know, and the report mostly cannot tell you that happened. It does not measure curriculum mastery. MAP samples a broad span of math, so if your school teaches a topic late in the year, a fall score can understate end-of-year performance. That is a sequencing artifact, not a gap. And it does not resolve individual skills. The broad score can hold steady while a specific foundation skill needs review underneath it for a year or more.
That last point is the one that matters most for what comes next. It is the why we flagged at the start, the layer the report cannot print. The report can tell you that something in algebraic thinking looks soft. It cannot tell you which prerequisite skill is missing. Knowing the exact skill, the difference between needing review on ratios and needing review on writing expressions, is what turns a worried evening into a concrete plan. That skill-level picture sits at a different resolution than MAP was designed to measure, which is the whole reason an interpretation step exists between the score and the practice.
What you can do this week
Four steps, in order. None require waiting for the school.
One. Find the full report, not just the summary. If you only received a single number, email the school office and ask for "the full MAP Growth Family Report, including instructional area scores." Some schools send the condensed version by default.
Two. Read it in the order above. Achievement, then growth, then projections, then strands. Resist forming a verdict from the top number alone.
Three. Look at the strand bars and note the lowest one. If it sits well below the others and it has stayed low across more than one test, write down which strand it is. That is your starting question for the teacher: "Her algebraic thinking strand has been the lowest two windows running. Which specific skills in that area should she shore up?"
Four. If the teacher cannot name specific skills, or the report does not break them out, find them another way. The MAP report tells you the score. A skill-level map tells you the skills behind it. For the broader question of what a MAP score really means, we wrote that up separately. We built Helix Math for exactly that step. The Helix Program begins with a 30 to 40 minute diagnostic, designed to help surface which skills appear secure, which are still developing, and which may need more attention. If you want to see what that finer layer looks like once you have it, here is how to read a Helix diagnostic report.
The report is not a verdict on your child. It is a snapshot, taken from far enough away to see the whole landscape and too far to see any single tree. Read it for what it is, give the small swings no power they have not earned, and let the strand bars point you toward the right question. The number is a starting point. Your child is not the number.
MAP® and RIT® are registered trademarks of NWEA. Helix Math is not affiliated with or endorsed by NWEA.