The math transitions that decide everything
Your daughter got A's in 6th-grade math all year. The spring MAP® score came back at the 72nd percentile. Above average, the teacher said. The district placement letter arrived in July: "Your child has been placed in on-level 7th-grade math." No explanation. No appeal process listed.
Or the reverse: your son scraped B's and C's through 7th-grade pre-algebra. His MAP percentile was 68th. The placement letter said "Algebra 1" for 8th grade. You called the counselor. She cited the cutoff: "60th percentile or higher qualifies for Algebra 1." Three weeks into the school year, he is underwater.
Both parents are asking the same question: What did we miss, and when did it happen?
The short answer
- Math has three narrow load-bearing transitions where a small number of skills do disproportionate work: fractions into ratios (5th to 6th grade), ratios into proportional reasoning (6th to 7th), and proportional reasoning into algebra (7th to 8th).
- A child can carry foundation skills that are not yet secure through the first two transitions without it surfacing. Assignments get completed, grades stay high, MAP scores hover near the 60th or 70th percentile.
- Then 7th-grade pre-algebra or 8th-grade algebra stops working, and a placement decision already happened based on a single MAP percentile that sampled but did not audit those underlying skills.
- MAP measures where a student is performing. It does not tell you whether the skills underneath are secure. Districts use percentile cutoffs (60th, 80th, 90th) for placement, but percentiles compress high-dimensional skill states into one number.
The pattern parents see but cannot name
The parent forums all tell versions of the same story. "She had straight A's in 6th-grade math and got placed into basic 7th." Or the reverse: "He's in honors pre-algebra and drowning. His MAP score was fine." Neither grades nor MAP percentiles predicted what happened.
Districts cite cutoffs. Northville Schools in Michigan requires 80th percentile on NWEA MAP for accelerated math. Another district sets the bar at RIT® 252 or higher for accelerated 7th grade. Parents see those numbers and think "fine," then watch a child struggle or get tracked incorrectly.
The gap is not between the child and the material. The gap is between assignment completion and transferable conceptual mastery. Neither MAP nor classroom grades audit that difference.
MAP is built for broad placement and growth tracking across years of schooling. It samples the construct rather than exhaustively testing every strand. Because adaptive tests sample broadly, a student may not see enough items within a single foundation skill area to show how reliably that skill holds. The broad score can hold steady while specific foundation skills still need review underneath.
Classroom grades measure whether assignments were completed, often with scaffolding present: the example on the board, the hint from the teacher, the calculator, the retry. Grades do not measure whether the skill transfers when the scaffolding is removed.
The math placement transitions middle school families need to understand are not really about scheduling. They are about three load-bearing skill transitions in elementary and middle school math where unfinished foundation skills can hide for a long time. The first two transitions are often navigable with pattern-matching and memorized procedures. The third transition is much less forgiving of procedural understanding alone.
Transition 1: Fractions into ratios (5th to 6th grade)
The first hinge. Fifth-grade fraction mastery is the foundation for 6th-grade ratio reasoning. CCSS standards 5.NF.A.1 through 5.NF.B.7 cover fraction equivalence, magnitude on a number line, and operations with fractions. Sixth-grade standards 6.RP.A.2 and 6.RP.A.3 cover unit rates, ratio tables, and percent problems.
A child can carry unfinished fraction sense into 6th grade by memorizing procedures. Flip and multiply for division. Cross-multiply for equivalence. The assignments get done. The grade stays high.
But ratio unit rates and percent problems require magnitude reasoning and multiplicative thinking, not just procedures. When the fraction foundation is not secure, 6th-grade ratio work only holds in familiar formats. Correct answers on the practiced version. Confusion on anything new.
The research here is remarkably consistent. Siegler and colleagues (2012) found that 5th-grade fractions knowledge predicts 11th-grade algebra performance above IQ, whole-number skill, and socioeconomic status. The National Math Advisory Panel (2008) surveyed 700 algebra teachers and asked them to name the top readiness gap. Fraction skills that were not secure was the most common answer.
The three fraction sub-skills parents should check at home:
Fraction magnitude on a number line. Can your child place 3/5 between 1/2 and 1 without hesitation? Not by converting to decimals. Not by cross-multiplying to find common denominators. By reasoning about size. If they hesitate or reach for a procedure, the magnitude foundation is not secure yet.
Equivalent fractions without the algorithm. Ask: "3/4 equals what over 12?" If the answer comes from reasoning ("I need to make the denominator 4 times bigger, so the numerator has to be 4 times bigger too, so 12"), the skill is secure. If the answer comes from "multiply top and bottom by 3," the skill is procedural. Procedural works until it does not transfer.
Fraction division with a story problem. Not "what is 2/3 divided by 1/4?" but "You have 2/3 of a pizza. Each serving is 1/4 of a pizza. How many servings do you have?" If your child flips and multiplies without pausing to make sense of the situation, the conceptual layer is missing. The procedure works. The reasoning does not travel.
When fraction magnitude, equivalence reasoning, and operation sense are all secure, the transition to 6th-grade ratios is smooth. When any of the three needs review, ratio work becomes pattern-matching. The pattern-matching survives 6th grade. It does not survive 7th.
Transition 2: Ratios into proportional relationships (6th to 7th grade)
The second hinge, and one where broad composite measurement can compress important variation underneath.
Sixth-grade ratio work (6.RP.A.2, 6.RP.A.3) is introductory: unit rates, ratio tables, percent of a quantity. Seventh-grade proportional reasoning (7.RP.A.2, 7.RP.A.3) is the algebra bridge: recognizing proportional relationships in tables and graphs, identifying the constant of proportionality k, writing the equation y = kx.
A student can complete 6th-grade ratio assignments by pattern-matching. "Set up a proportion and cross-multiply." The assignments get done. The MAP score stays above the 60th percentile. The grade is a B or an A.
But the student never reasoned about what a proportional relationship is. They memorized when to cross-multiply. They did not internalize that a proportional relationship means "one quantity is always the same multiple of the other."
Because MAP is adaptive and samples broadly across the construct, students may not see enough items within a specific skill area to show how reliably that skill holds. The percentile reflects broad performance. The reasoning underneath sits at a different resolution.
Districts use MAP percentiles to place students into pre-algebra or algebra. A 60th percentile cutoff admits students who may have navigated 6th-grade ratios procedurally. The 2025 MAP norms shift means the same RIT now yields a higher percentile than it did under 2020 norms. Where districts use fixed percentile cutoffs, that shift is worth examining alongside the placement criteria, since the reference population has changed.
The diagnostic question parents should ask at home:
"Here is a table showing hours worked and pay earned. What is the relationship? Can you write an equation?"
| Hours | Pay |
|---|---|
| 2 | $30 |
| 3 | $45 |
| 5 | $75 |
If your child recognizes that pay is always 15 times the hours and writes y = 15x, the 7.RP foundation is secure.
If your child sets up a proportion ("2 is to 30 as 3 is to what?") and cross-multiplies, they are pattern-matching. The skill is procedural. It will not transfer to 8th-grade slope and function notation.
This is a recurring pattern when 8th-grade algebra placements turn out to be premature. The student was placed based on a percentile that summarized broad math achievement. That percentile operates at a different resolution than the question of whether proportional reasoning is conceptually owned or procedurally mimicked. The pacing of the course often assumes those foundations are already secure. They may not be there yet.
Transition 3: Proportional reasoning into algebra (7th to 8th grade)
The third hinge. Seventh-grade proportional reasoning (7.RP.A.2) feeds directly into 8th-grade linear functions (8.F.A.2, 8.F.B.4). If y = kx is not secure in 7th grade, then slope, rate of change, and function notation in 8th-grade algebra are out of reach.
The placement decision happens at the end of 7th grade based on three inputs: 7th-grade math grade, spring MAP percentile, and sometimes a district placement test. None of these instruments check whether the skills underneath are secure.
A 7th grader can earn an A by completing assignments with scaffolding. The calculator is allowed. The hint is on the board. The example is fresh. The retry is permitted. The grade reflects completion and effort. It does not reflect whether the skill transfers when the scaffolding is removed.
A 7th grader can score in the 75th percentile on MAP while their understanding of proportionality is still developing. Adaptive tests sample broadly across the construct, so a student may not see enough items in any one foundation skill area to show how reliably that skill holds.
The structure of an 8th-grade algebra course does not re-teach 7.RP. The pacing assumes "they placed in, so the foundation is there." The first unit is solving linear equations. The second unit is graphing linear functions. Both require fluent proportional reasoning. If that reasoning is not secure, the student falls behind in week two.
Two things parents should verify before accepting an algebra placement:
Can your child graph a proportional relationship and identify the constant from the graph, not the table? Show them a graph where y = 3x. Ask: "What is the equation?" If they can read the slope from the graph and write y = 3x, the skill is secure. If they need to see a table first, the reasoning is not yet visual. Algebra lives in the graph. Ratio work lived in the table. The transition from table to graph is the 7.RP skill. If it is not secure, algebra will feel out of reach.
Can your child write the equation for a proportional relationship given a verbal description, without seeing a worked example first? "A car travels at a constant speed. After 2 hours, it has gone 120 miles. Write an equation relating distance and time." If they write d = 60t, the reasoning is secure. If they ask for an example or reach for a ratio table, the understanding is still developing.
If either answer is no, the placement may be premature. That is not a failure. That is a diagnostic signal. The missing prerequisite skill can be built. It is easier to build it in 7th grade than to carry the gap into 8th-grade algebra and watch the whole thing stop working.
The reverse injustice also happens. The student who does own 7.RP reasoning but gets placed into on-level 8th-grade math because their grade was a B or their MAP percentile was 58th. Solid reasoning hidden by a compressed score. Districts cannot audit this at scale. Parents can verify it at home in ten minutes.
The resolution problem: broad scores and load-bearing skills
A MAP percentile tells you roughly where a student sits relative to same-grade peers on a general math construct. It is a norm-referenced overlay on a criterion-referenced scale. The RIT itself is anchored to item difficulty via the Rasch model. The percentile layer maps that RIT to a population sample.
Districts use percentile cutoffs because they need a sorting mechanism at scale. Sixty percent for on-level. Eighty percent for accelerated. Ninety percent or higher for honors. Those cutoffs are not wrong. They are operationally coarse, by design.
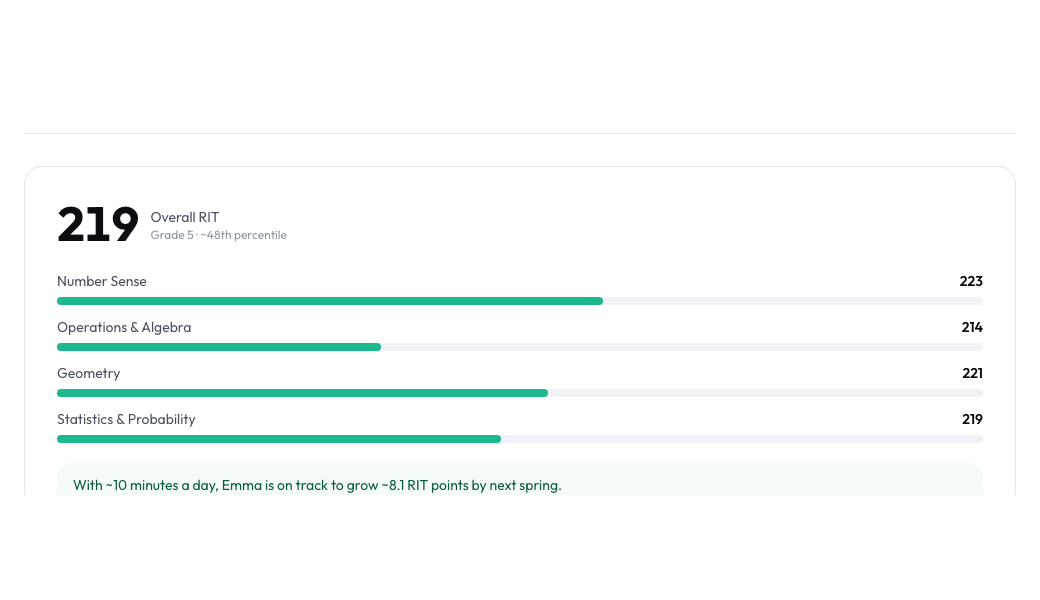
Two students with the same broad score can have completely different skill profiles underneath. One secure on ratios and needing review on fractions. The other secure on number sense and needing review on geometry. The composite summarizes both into the same number.
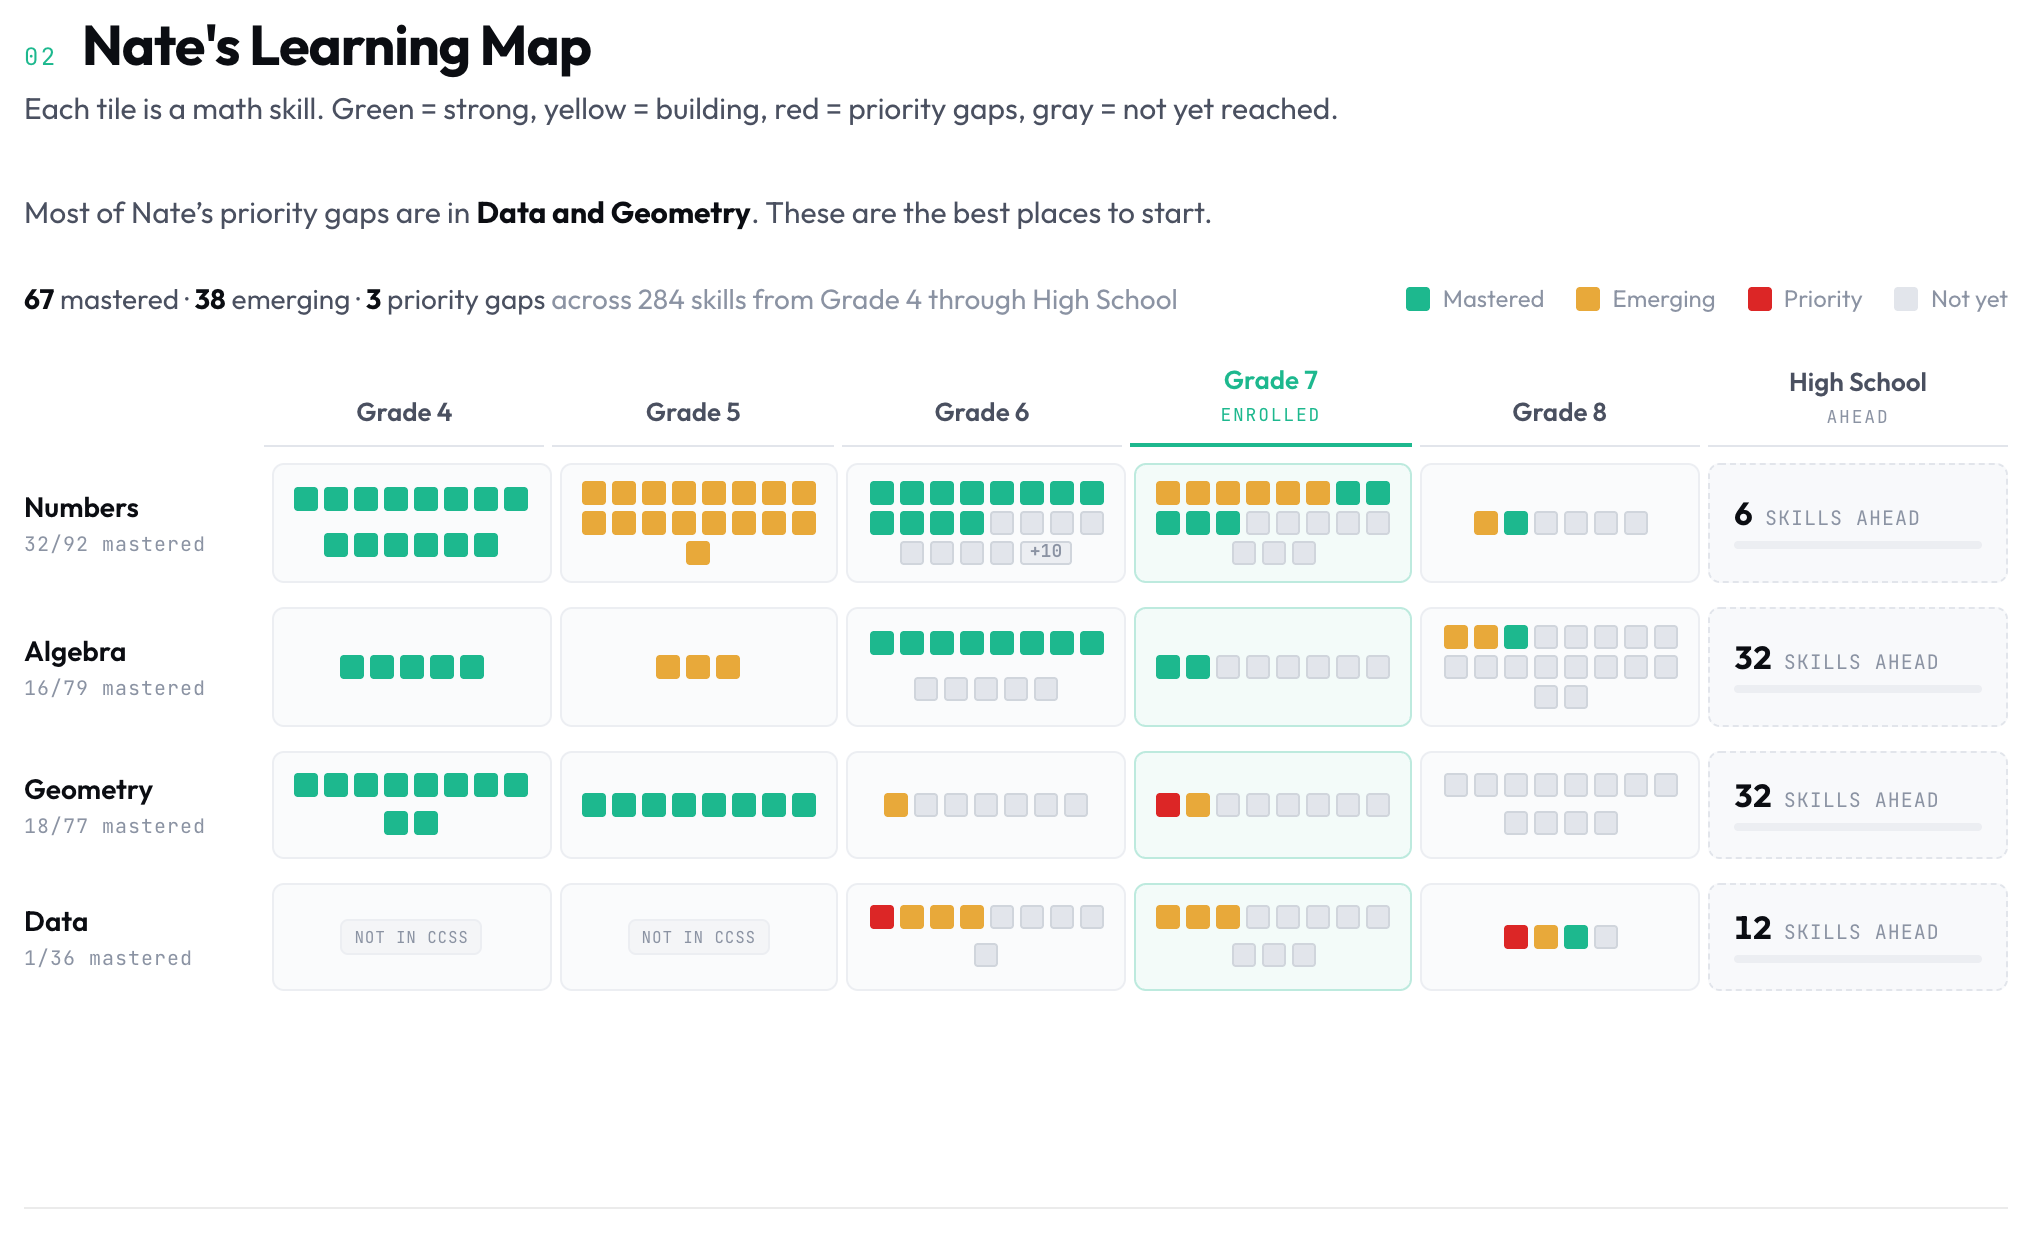
There is also a measurement-uncertainty layer worth noting. NWEA reports a standard error of measurement near 3 RIT on the composite, so small year-over-year changes often sit inside that band before they should be read as meaningful growth.
The deeper resolution issue is structural, not statistical. Adaptive testing samples broadly across the construct. A student performing well moves up the difficulty ladder, and within any one foundation skill area there may not be enough items to show how reliably the skill holds. The score reflects broad performance. The skill-level picture sits at a finer resolution.
Under the 2025 MAP norms, a 6th-grade spring RIT of 230 corresponds to roughly the 75th percentile. Under the 2020 norms, the same RIT was closer to the 68th percentile. The student did not change. The reference population did. Where districts use fixed percentile cutoffs, that shift is worth examining alongside the placement criteria.
This is not a flaw in MAP. It is the scope MAP was designed for: broad placement and growth measurement across years of schooling. The resolution parents need lives at a different layer.
What you can do this week
Three actions, ordered by immediacy.
If your child has a placement decision coming up. End of 5th, 6th, or 7th grade. Verify the three diagnostic questions from this post. Fraction magnitude on a number line. Ratio table to equation without scaffolding. Proportional relationship from graph, not table. Spend ten minutes. If any answer is uncertain, the placement may be optimistic. Not wrong. Optimistic. The gap can be built before the next transition. It is easier to build it now than to carry it forward.
If your child is already in an accelerated track and struggling. Check whether the struggle is foundational or pace. Foundational means missing 7.RP reasoning or missing fraction equivalence. Pace means they have the skills but need more time to consolidate. If the struggle is foundational, moving to on-level is not failure. It is building the missing prerequisite skills before the next transition. A student who builds secure 7.RP reasoning in on-level 8th grade is better positioned for high school algebra than a student who survives accelerated 8th-grade algebra by pattern-matching.
If your child was placed into on-level but you suspect stronger reasoning. Ask the teacher for examples of where the placement test or MAP flagged a skill for review. If the answer is vague or percentile-only, the placement may be underestimating them. Request a review. Bring evidence. "She can write the equation for a proportional relationship from a graph. She can explain why the constant of proportionality is the unit rate. The MAP percentile was 58th, but the reasoning underneath is secure."
Do not let a single MAP score decide a two-year track without auditing the layer underneath. Schools use the tools they have. Parents can verify what those tools compress.
The interpretive layer underneath the score
A broad score tells you where a student is performing. It does not tell you whether the skills underneath are secure. Grades tell you assignments were completed. They do not tell you whether scaffolding was present when they were.
The gap between assignment completion and transferable mastery is the gap that decides placement outcomes. Districts cannot audit it at scale. Parents can audit it at home in ten minutes with three questions.
Fractions into ratios. Ratios into proportional reasoning. Proportional reasoning into algebra. The first two transitions can often be survived procedurally. The third is substantially less forgiving of procedural understanding alone. A student who carries unfinished reasoning through the first two will find the third much harder to work around.
That is what Helix Math was built for. Help surface which skills appear secure and which may still need review, so the next transition is met with more of the prerequisite skills already in place.
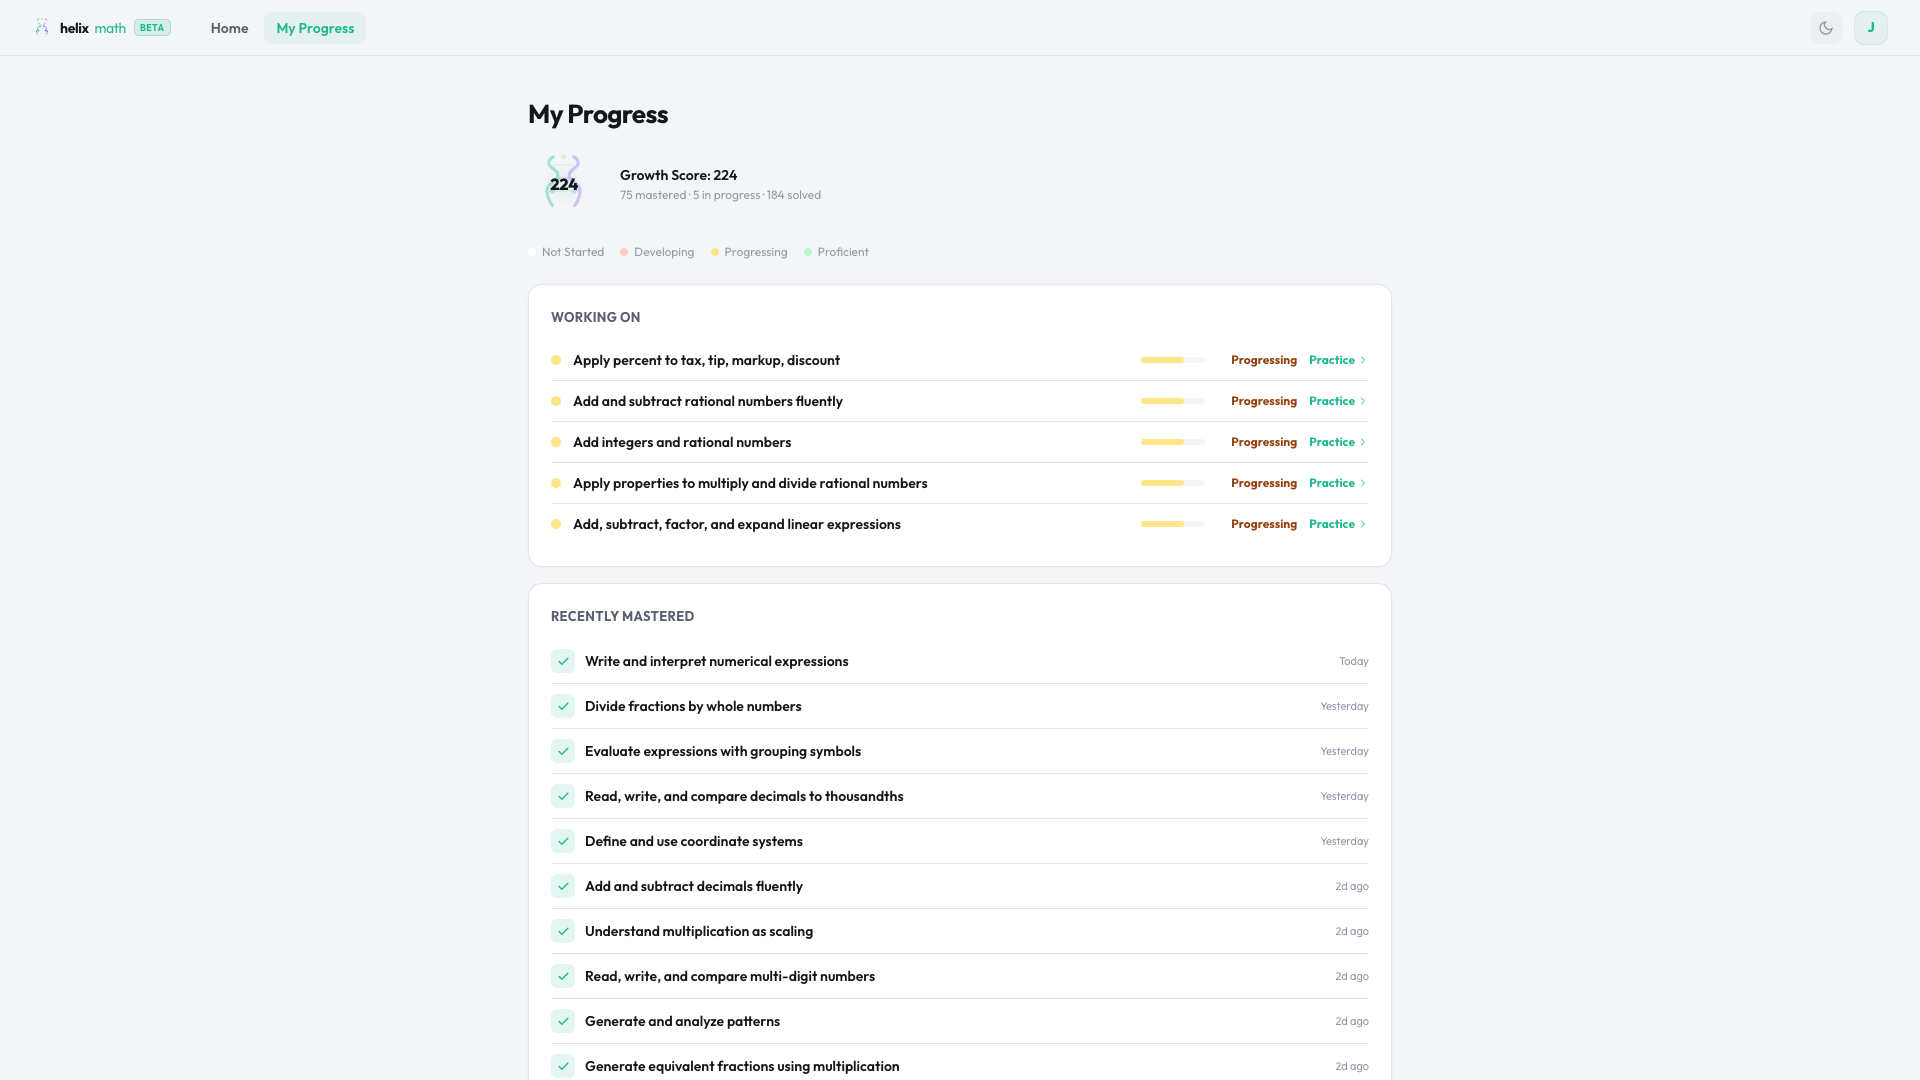
Each transition has a free fourteen-question check on the year it lands in: grade 6 for the ratio jump, grade 7 for proportional reasoning, and grade 8 for functions and linear equations. About fifteen minutes each, no sign-up, and the year before the transition is the useful one to run.
Start the Helix Program to see your child's skill-level map across the three transitions that decide algebra readiness.
MAP® and RIT® are registered trademarks of NWEA. Helix Math is not affiliated with or endorsed by NWEA.